50+ Prediction Market Statistics for 2026: Size, Ad Spend & Growth
Key takeaways
- $200M in digital ad spend. Prediction-market platforms spent nearly $200 million on digital advertising through the first seven months of 2026. 1
- +650% in search interest. Worldwide search interest for “prediction market” increased 650% over the past five years.2
- $22–$50 CPC. Blockchain-Ads Research Institute data puts average prediction-market cost per click within this range.3
- +40,400% YoY: “Decentralized prediction market.” Searches for “decentralized prediction market” recorded 40,400% year-over-year growth.3
- January 21, 2026. Google began allowing qualifying prediction-market advertising in the U.S. from January 21, 2026.4
Prediction markets are growing fast. Rising trading activity, advertising spend, search demand, and mainstream adoption are expanding the category.
This article brings together the latest prediction market statistics on market size, trading activity, advertising spend, acquisition costs, search demand, audience trends, and regulation. It includes 50+ data points, with figures sourced from Google Trends, Google Ads Keyword Planner, industry research, company disclosures, and regulatory sources.
Note that this page will be refreshed on a quarterly basis with the latest prediction market statistics covering market size, advertising, acquisition costs, search demand, audience, and regulation.
Prediction Market Size And Growth
1. $40B+ in 2025 volume. Combined trading volume across Kalshi and Polymarket exceeded $40 billion in 2025.5
2. ~$9B in 2024 volume. Combined Kalshi and Polymarket volume was roughly $9 billion in 2024.5
3. 400%+ YoY growth for 2025 expansion. Combined trading volume increased by more than 400% from 2024 to 2025.5
4. $263.5M in fee revenue. Kalshi generated $263.5 million in fee revenue on $22.9 billion of volume in the period analyzed by KPMG.5
5. $22.9B in trading volume. Kalshi recorded $22.9 billion in trading volume in the KPMG analysis.5
6. $3B+ monthly volume. Polymarket surpassed $3 billion in monthly volume by October 2025.5
7. 17 DCM applications. Seventeen new designated contract market applications had been filed with the CFTC since early 2025.5
8. 7 approved DCM applications. Seven of those applications had been approved, including Polymarket’s U.S. re-entry and Gemini’s crypto-native prediction-market license.5
9. 38 states. DraftKings launched as a CFTC-registered Introducing Broker, bringing prediction markets to 38 states through its existing user base.5
10. Less than $5B monthly volume. Combined monthly global volume on Kalshi and Polymarket was below $5 billion in September 2025.6
11. ~$24B monthly volume. Combined monthly global volume reached about $24 billion in April 2026.6
12. ~$14B monthly sportsbook wagering. Legal U.S. sportsbooks averaged around $14 billion in monthly wagering during 2025.6
13. $44.8B in June volume for Kalshi, Polymarket, and Polymarket US. The three platforms recorded $44.8 billion in combined monthly trading volume in June 2026.7
14. $25.66B in May volume. Combined volume was $25.66 billion in May 2026 before the June surge.7
15. 75% monthly growth. Combined volume increased 75% from May to June.7
16. $31.5B in June volume. Kalshi accounted for $31.5 billion of June’s combined volume.7
17. $50.59B in July volume. Kalshi, Polymarket, and Polymarket US reached $50.59 billion in combined monthly trading volume in July 2026.7
18. 7.8% monthly growth. July’s $50.59 billion total represented a 7.8% increase from June.7
19. $37.7B in July volume. Kalshi generated approximately $37.7 billion in July volume.7
20. $12.9B in July volume. Polymarket and Polymarket US combined for roughly $12.9 billion in July.7
21. $1.3B in April volume. Polymarket US recorded approximately $1.3 billion in April 2026 trading volume.6
22. $9B in April volume. Polymarket’s international platform recorded approximately $9 billion in April 2026 volume.6
Prediction Market Advertising Spend
23. ~$200M in digital ad spend. Prediction markets spent nearly $200 million on digital advertising through July 2026. 1
24. Nearly 14% decline in digital ad impressions for online sportsbooks in 2025.1
25. 72% more ads. Consumers had already seen 72% more prediction-market ads by May 15, 2026, than during all of 2025.1
26. 45% of digital sports-betting ads. Prediction-market advertising represented 45% of digital sports-betting advertising measured in the AGA's May 2026 snapshot.1
27. ~$2,000 ad cost. Kalshi's AI-generated NBA Finals commercial reportedly cost about $2,000 to produce.8
28. 2–3 days to make an AI commercial production. The Kalshi's commercial took roughly two to three days to create.8
29. 300–400 generated clips for Kalshi's commercial. The creator generated roughly 300–400 clips to produce the final commercial.8
30. ~$8 ~$8M—30-second Super Bowl ad benchmark. A 30-second Super Bowl commercial was priced at approximately $8 million in 2026.9
31. 2026 Super Bowl ban on NFL prediction-market advertising. The NFL prohibited prediction-market platforms from buying Super Bowl television commercial time in 2026.9
How much does it cost to advertise?
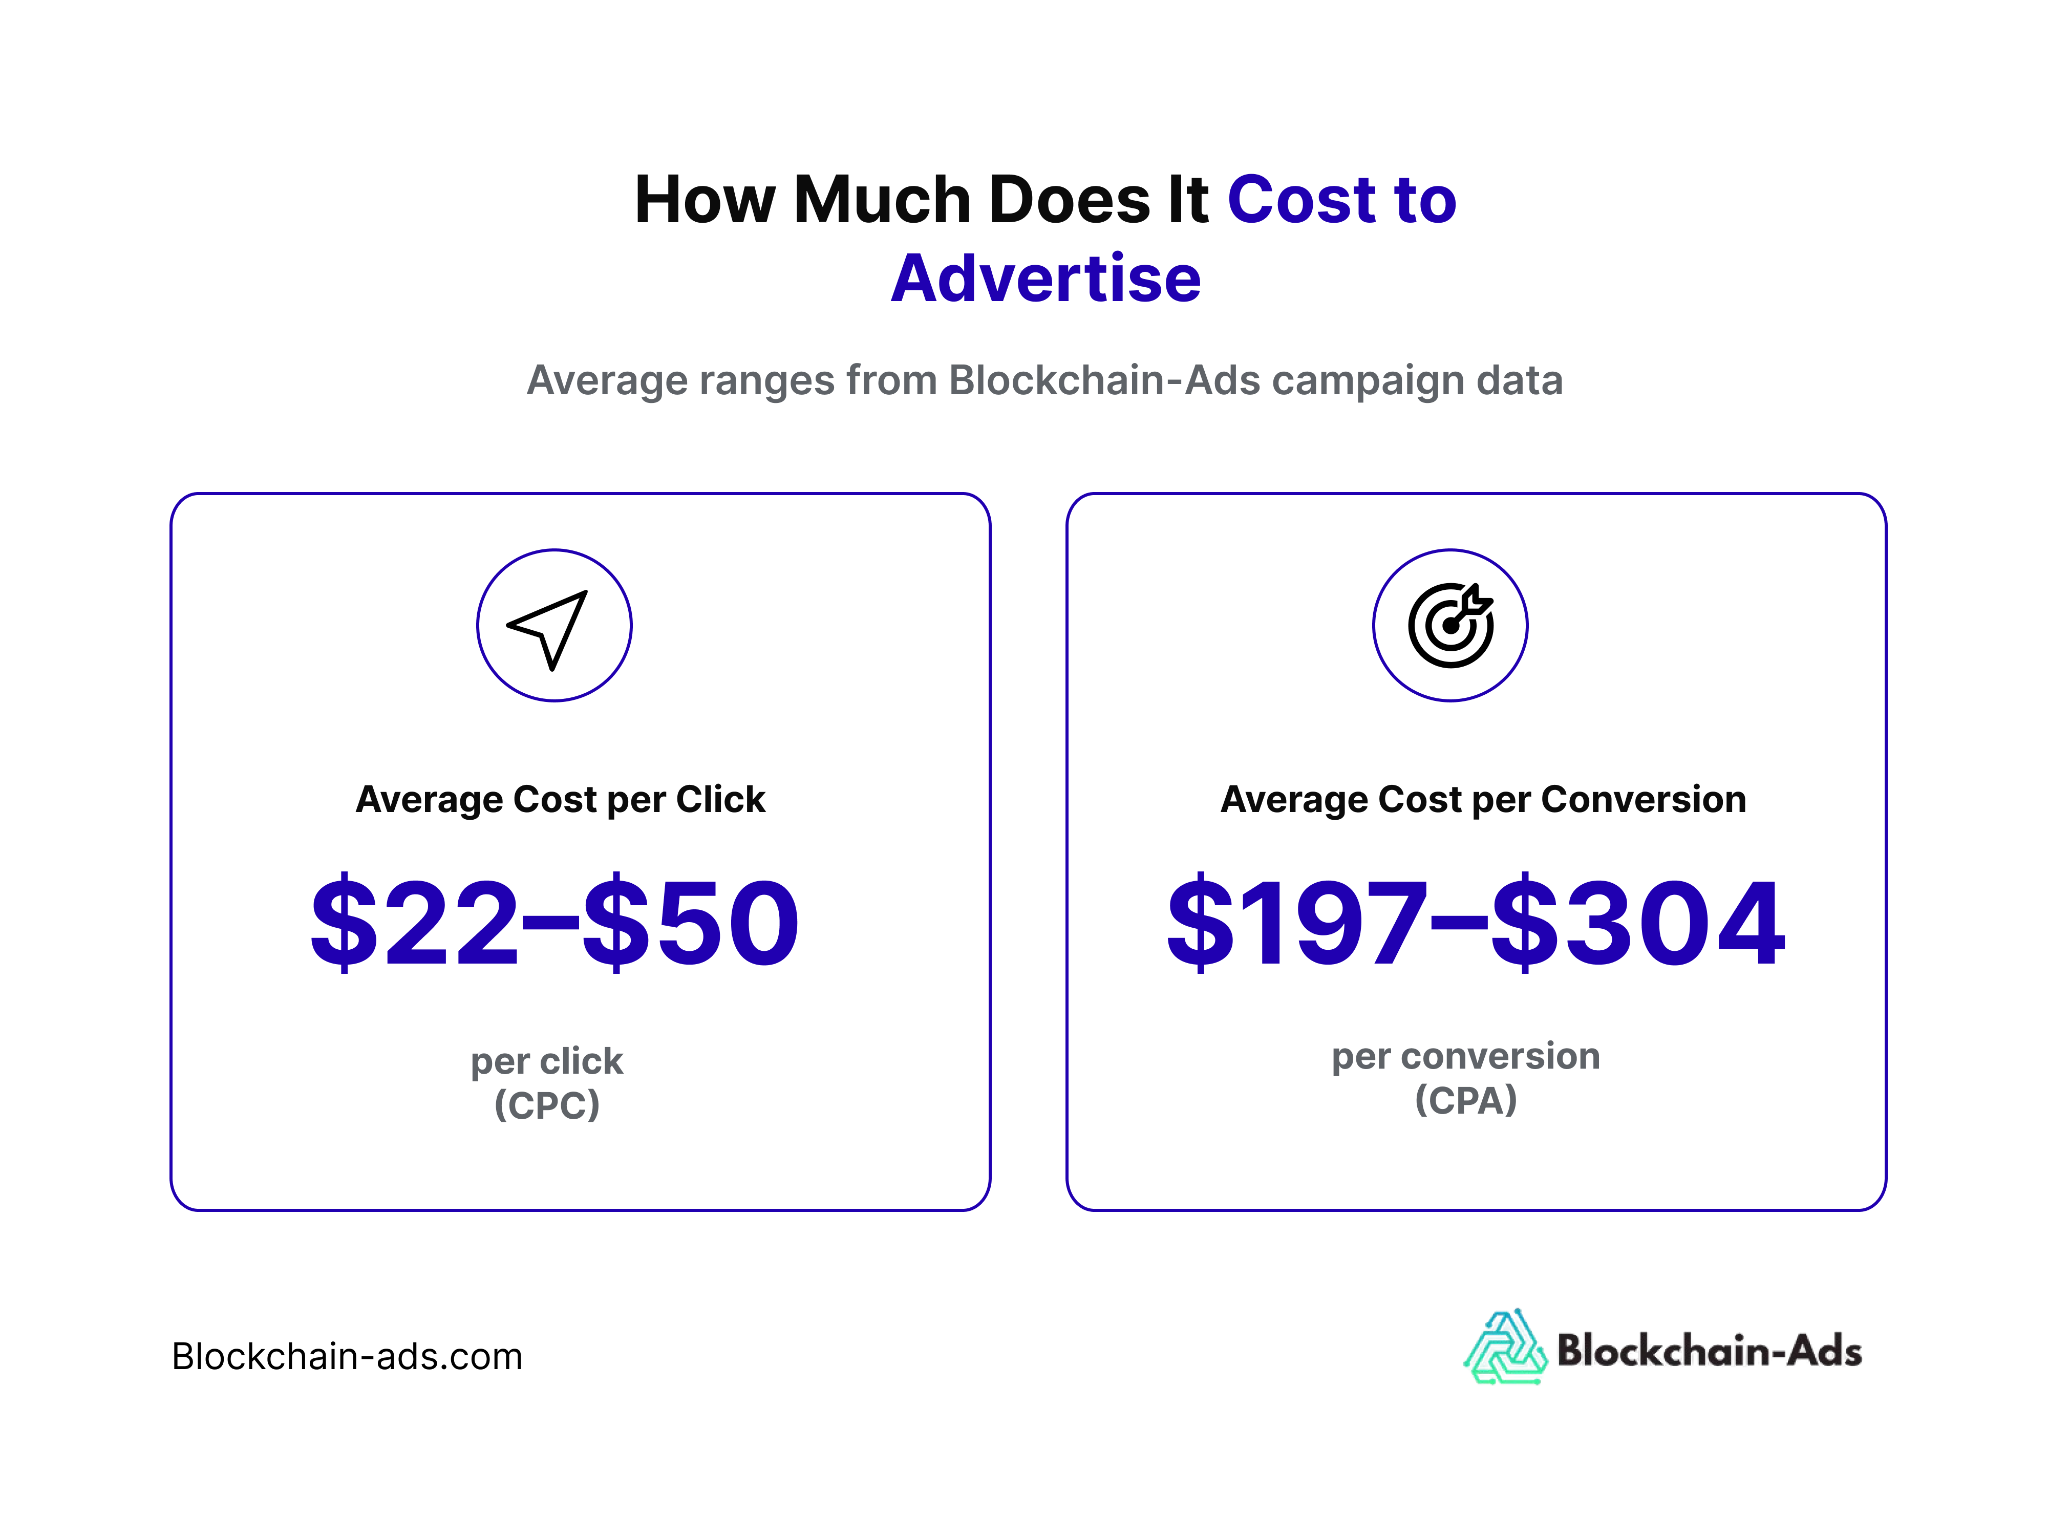
32. $22–$50 CPC is the average cost per click that falls within this range in Blockchain-Ads campaign data.3
33. $197–$304 per conversion is the average cost per conversion, which falls within this range in the same campaign dataset.3
Prediction Market Search Demand (2025–2026)
34. +650%. Worldwide Google search interest for the category has increased 650% over five years.2
Check this out: An overview of Google Ads prediction markets policy.
Search demand growth
35. March 1, 2026: "Prediction market” overtook “sports betting” in worldwide Google search interest during the week of March 1, 2026.2
36. +27,800%: Kalshi recorded 27,800% growth among Google Trends rising queries over the five-year period.2
37. +20,850%: Polymarket recorded 20,850% growth among Google Trends rising queries over the same period.2
38. 14,800 monthly searches in U.S. demand. “Prediction market” generated 14,800 estimated U.S. monthly searches in the September 2026 Keyword Planner dataset.3
39 +1,985% YoY for U.S. search growth. The same “prediction market” keyword recorded 1,985% year-over-year growth in U.S. searches.3
40. +40,400% YoY: The keyword "Decentralized prediction market" recorded 40,400% year-over-year search growth.3
41. +9,567% YoY: “Prediction market app.” Searches for “prediction market app” increased 9,567% year over year.3
42. 2,900 monthly searches: Monthly searches for “kalshi ads” rose from 260 to 2,900 between August and October 2025.3
43. 1,000 monthly searches: “CFTC prediction markets” searches increased from 30 to 1,000 per month over the measured year.3
44. 2,900 monthly searches: Searches for “sportsbook marketing” declined from 12,100 to 2,900 monthly searches in the measured period.3
Read more: Find the best GEOs for prediction market advertising.
The Prediction Market Audience (Sports, Politics, Cryptocurrency) At A Glance
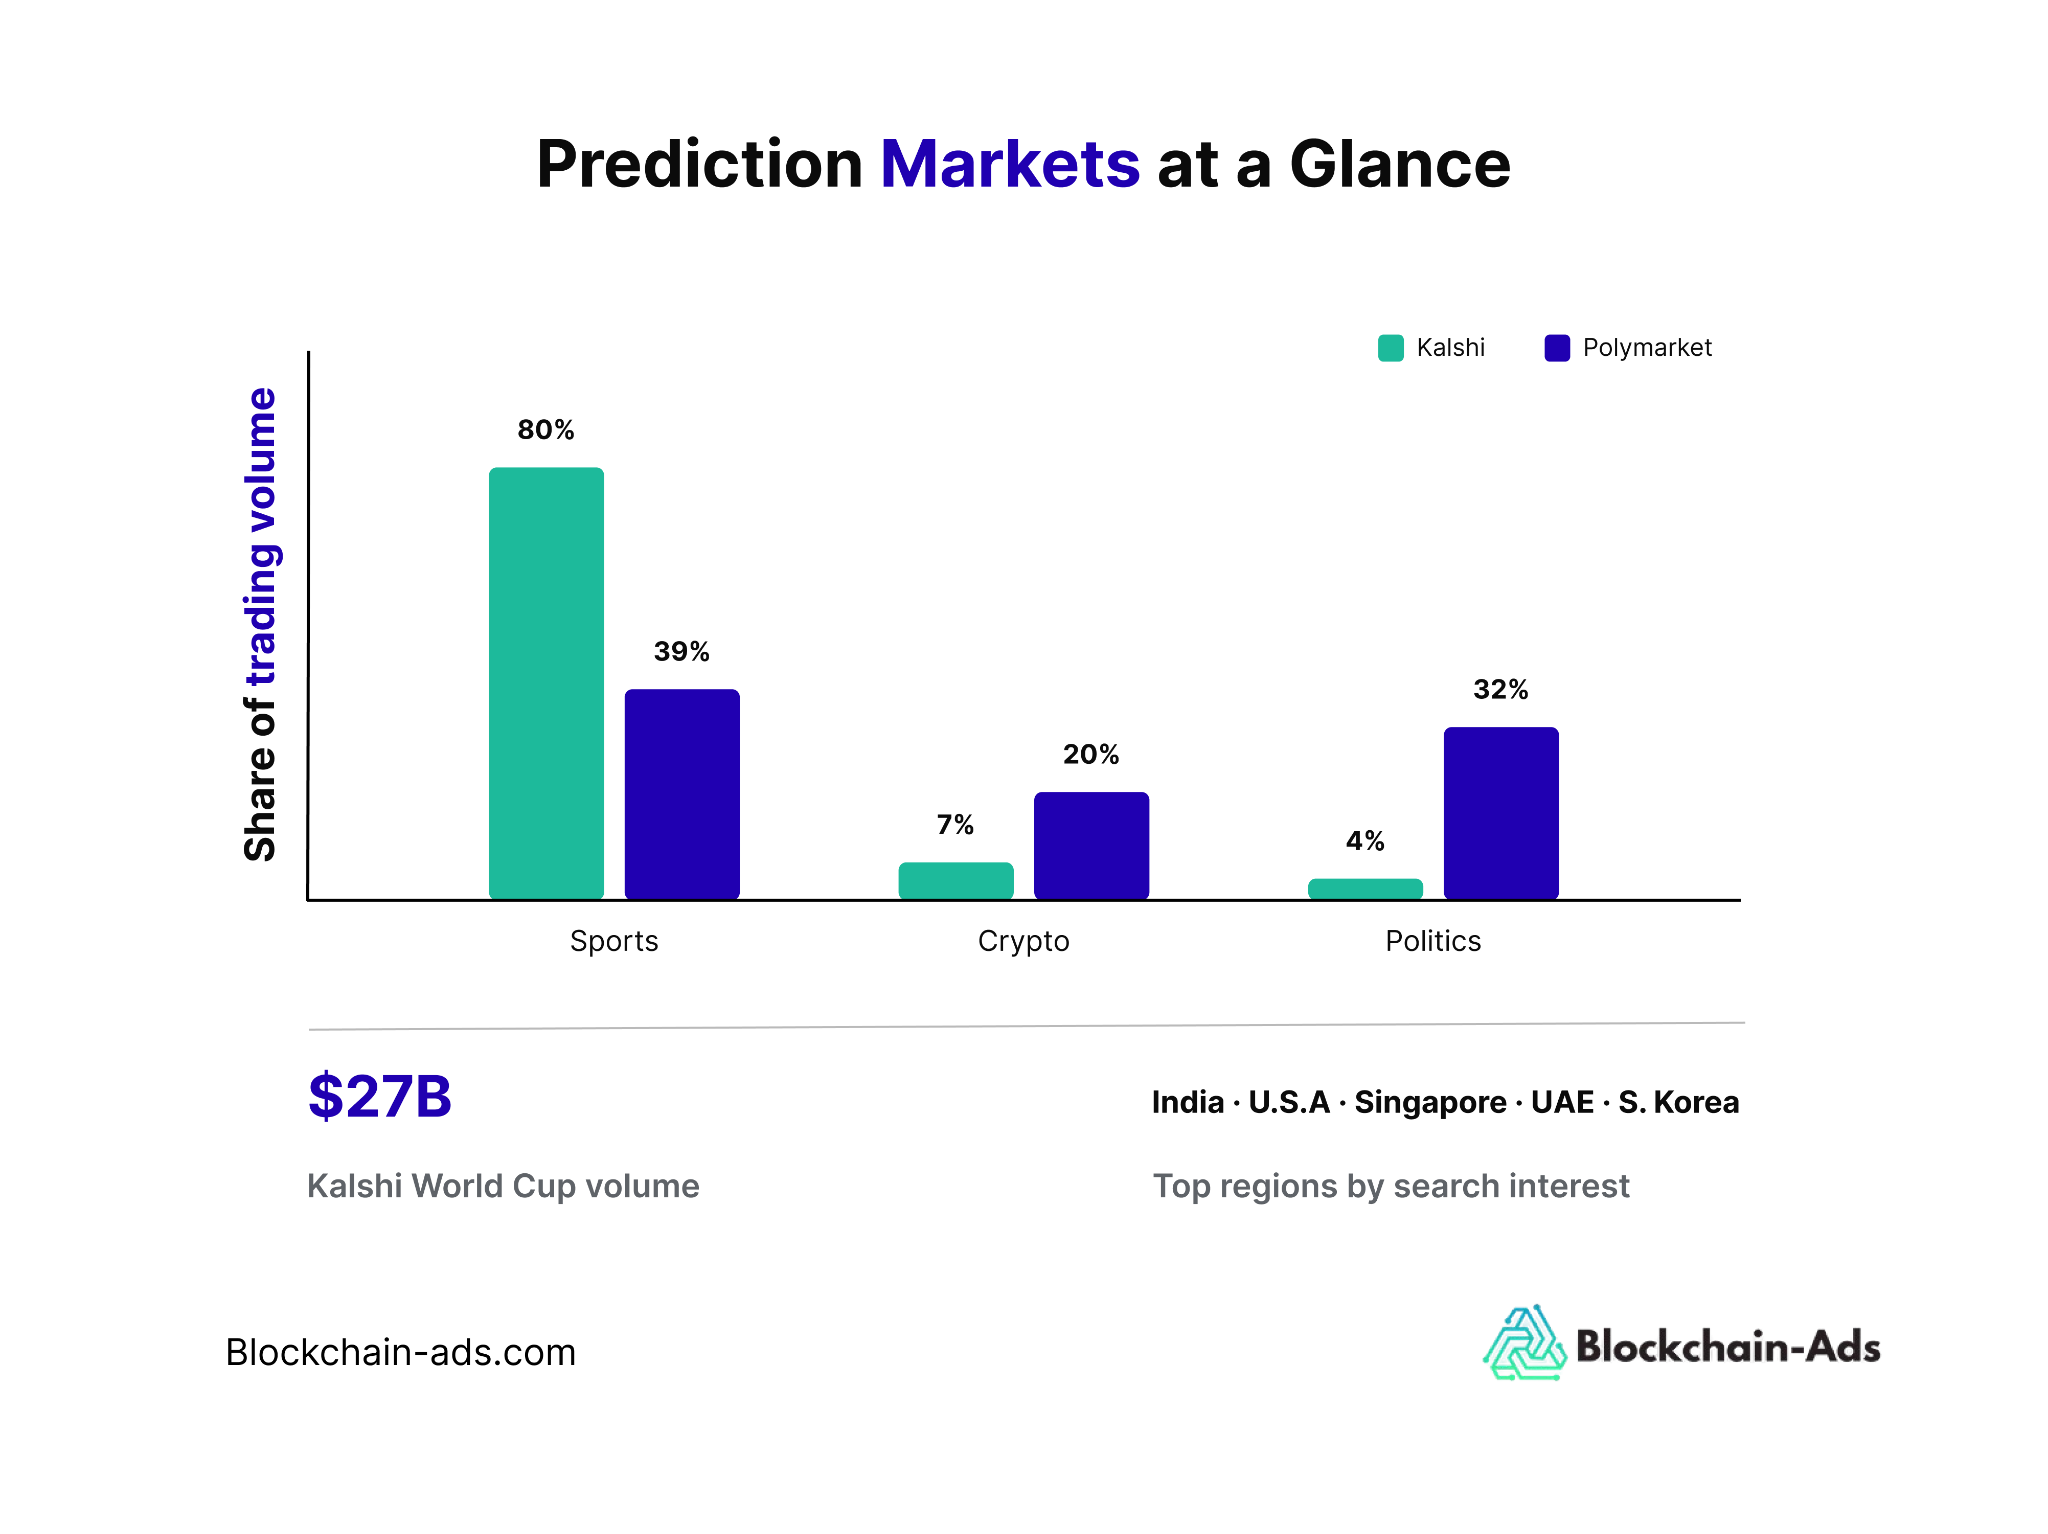
45. 5 leading regions. India, the U.S., Singapore, the UAE, and South Korea lead prediction-market search interest, providing an overview of prediction market user demographics across key markets.2
46. 80%. Sports have represented 80% of Kalshi's trading volume since July 2024.6
47. 39%. Sports have represented 39% of Polymarket's trading volume over the same period.6
48. 7%. Cryptocurrency contracts accounted for 7% of Kalshi's trading volume.6
49. 20%. Cryptocurrency contracts accounted for 20% of Polymarket's trading volume.6
50. 4%. Politics represented 4% of Kalshi's volume over the period analyzed by Pew.6
51. 32%. Politics represented 32% of Polymarket's volume.6
52. 90%. Political markets accounted for 90% of Kalshi's trading volume in October and November 2024.6
53. 65%. Political markets represented 65% of Polymarket's volume during October and November 2024.6
54. 27B in World Cup trading volume. Kalshi recorded $27 billion in trading volume during the tournament, roughly double its original $13 billion projection.15
Prediction market regulation
55. On January 21, 2026, Google began allowing qualifying prediction-market advertising in the U.S. on this date.4
56. 33 jurisdictions. The brief cites Polymarket as restricting access in roughly 33 jurisdictions worldwide.10
57. India's new online-gaming rules took effect on May 1, 2026, with prediction-market access subsequently restricted.11
58. ESMA event-contract statement was launched July 3, 2026, as they issued guidance on the treatment of event contracts under existing EU financial-market rules.12
Future trends
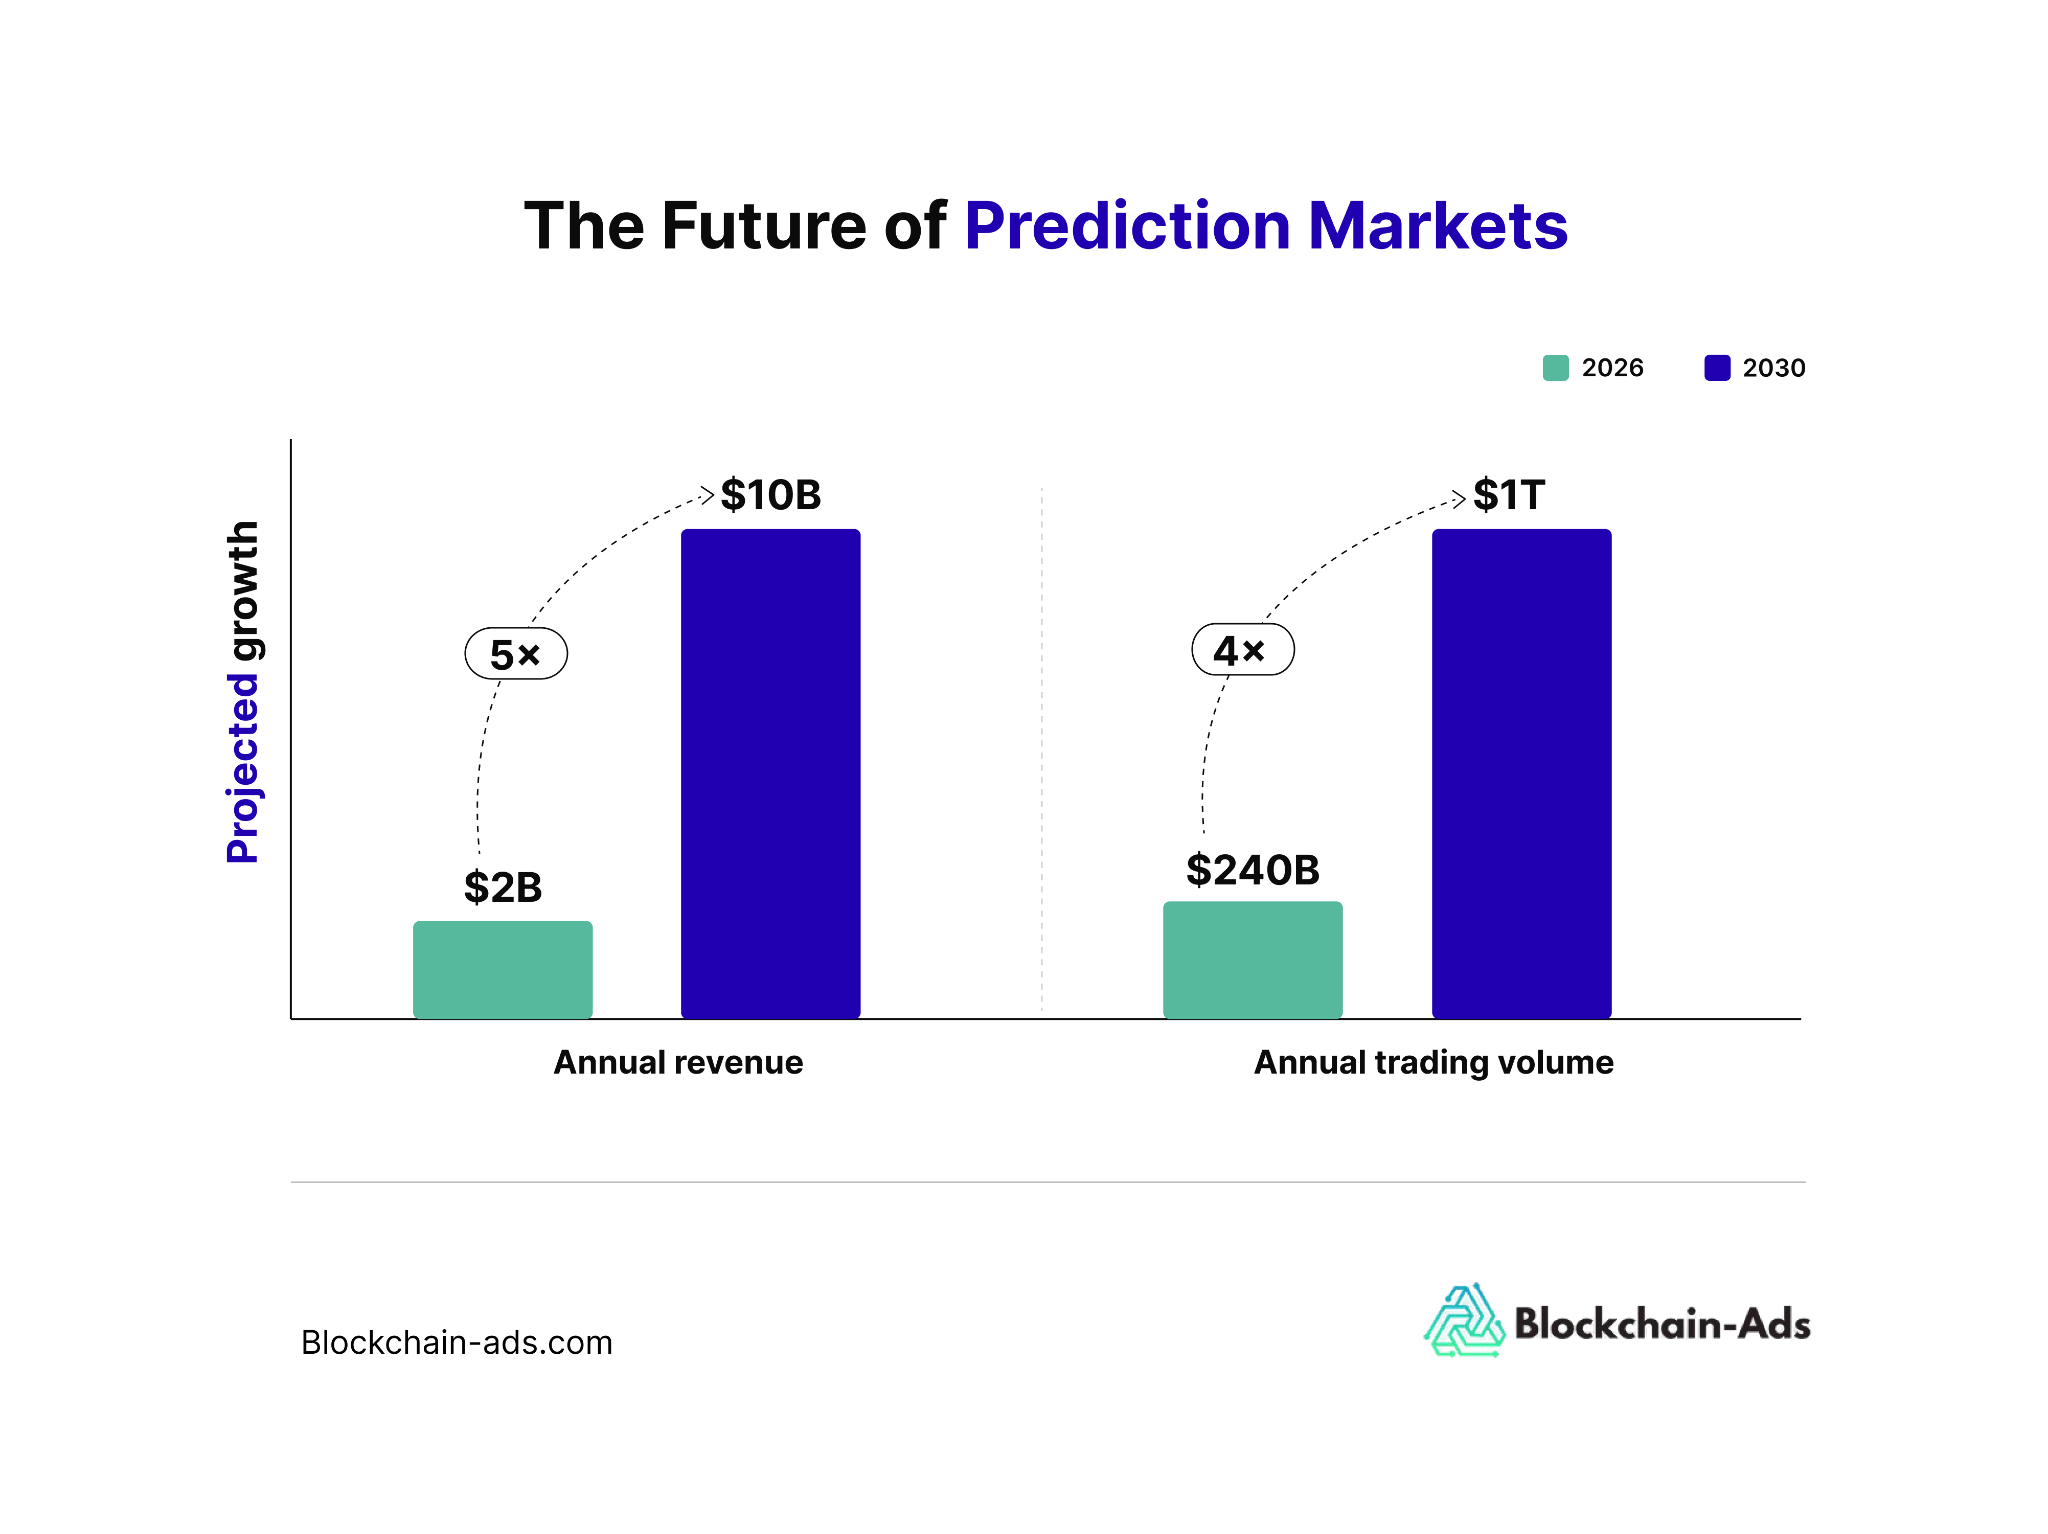
59. $10B annual revenue by 2030. Citizens Financial Group estimates that prediction markets could generate as much as $10 billion in annual revenue by 2030.13
60. ~$2B current annual revenue. The same Citizens estimate puts current annual industry revenue at around $2 billion.13
61. $240B in 2026 projected volume. Bernstein analysts projected prediction-market volume could reach $240 billion in 2026.14
62. $1T annual volume by 2030. Bernstein analysts projected annual prediction-market volume could reach $1 trillion by 2030.14
The takeaway
Prediction markets are scaling across trading volume, advertising, and search demand, with more operators entering the market. But reaching and acquiring traders remains a challenge, from accessing wider audiences to targeting the right users across fragmented advertising channels and regulated markets.
Ready to reach more prediction-market traders? Explore Blockchain-Ads’ prediction market advertising platform.
FAQs
What are prediction markets?
Prediction markets are platforms where users trade contracts tied to the outcome of future events, such as sports, economic indicators, politics, or other measurable events.
How big is the prediction market industry?
The industry has expanded rapidly, with major platforms recording tens of billions of dollars in monthly trading volume during 2026. Market-size estimates vary depending on whether they measure trading volume, revenue, or another metric.
How much does prediction market advertising cost?
Prediction-market advertising costs vary by keyword, geography, and competition. Our prediction market advertising costs guide covers CPCs, conversion costs, and acquisition benchmarks.
What are the best prediction market advertising platforms?
The best prediction market advertising platforms depend on your target audience, geography, certification status, and campaign goals. Platforms covered in our guide include Blockchain-Ads, Moloco, Google Ads, and Microsoft (Bing) Ads, each offering different approaches to reaching prediction-market audiences.
For a detailed breakdown of their features, use cases, and limitations, see the best prediction market advertising platforms.
Sources and Methodology
Each statistic is attributed to the source and dataset used:
- American Gaming Association: Digital advertising data for prediction-market operators, including estimated ad spend, ad impressions, and shifts in sports-betting advertising activity.
- Google Trends: Worldwide and regional search-interest data, including five-year growth, category comparisons, and rising queries for Kalshi and Polymarket.
- Blockchain-Ads Research Institute: Aggregated campaign data for prediction-market advertising, including CPC and cost-per-conversion benchmarks. Search-demand figures attributed to Blockchain-Ads’ use analysis of Google Ads Keyword Planner data.
- SBC Americas: Reporting on Google's January 2026 policy change allowing qualifying prediction markets to advertise in the U.S.
- KPMG: Industry analysis covering Kalshi and Polymarket trading volume, fee revenue, designated contract market applications, and market expansion.
- Pew Research Center: Analysis of prediction-market trading activity, including Kalshi and Polymarket monthly volume and the distribution of sports, cryptocurrency, and political contracts.
- The Block: Platform-level trading-volume data for Kalshi, Polymarket, and Polymarket US, including monthly volume and month-over-month growth.
- The Verge: Reporting on Kalshi's AI-generated NBA Finals commercial, including production cost, production time, and number of generated clips.
- MediaPost: Reporting on NFL restrictions on prediction-market advertising and 2026 Super Bowl advertising costs.
- ASGAM: Reporting on Polymarket's geographic access restrictions across international jurisdictions.
- The Print: Reporting on India's 2026 online-gaming rules and their impact on prediction-market access.
- European Securities and Markets Authority (ESMA): Regulatory guidance on the treatment of event contracts under EU financial-market rules.
- Forbes Advisor: Industry revenue estimates and operator expansion, including the Citizens Financial Group projection for prediction-market revenue.
- Forbes: Industry forecasts and reporting on projected prediction-market trading volume.
- Reuters: Reports on prediction market activity on Kalshi during the 2026 FIFA World Cup in the USA.
Freelance content writer/editor for B2B SaaS, AI, technology, partnerships brands.
View full profile →