Measuring Prediction Market Campaigns: Attribution, Tracking, and Reporting
Key takeaways
- Ad spend: Prediction markets spent nearly $200 million on digital advertising in the first seven months of 2026.
- Funnel drop-off: Blockchain-Ads recorded 2,210 registrations at $13.57 each for Dexsport, but only 110 funded first-time depositors at $272.73 each.
- LTV:CAC benchmark: Stripe cites a 3:1 LTV:CAC ratio as a generally accepted benchmark for acquisition spend.
- Event spikes: Prediction markets recorded $3.17 billion in trading volume on the Saturday of the 2026 NFL season's opening weekend, per Reuters.
- Browser share: Chrome held 69.4% of worldwide browser usage in August 2026, with Safari at 15.8%, each handling tracking differently.
Prediction markets spent nearly $200 million on digital advertising in the first seven months of 2026. With that much money going into acquisition, knowing which ads lead to funded traders becomes just as important as reaching them.
But prediction market attribution gets messy when traders switch devices, move between web and app, complete KYC later, or return to trade around a major event. This guide covers what to measure, which attribution models to use, where tracking breaks, and how to connect campaign ad spend with meaningful conversions.
What Is Prediction Market Campaign Measurement?
Prediction market campaign measurement connects ad spend to trader activity across the acquisition journey, from the first campaign interaction through sign-up, KYC, funding, and trading. It shows where traders convert and drop off. A low cost per sign-up may look efficient, but many of those traders may not complete KYC, fund their accounts, or place their first trade.
Prediction market attribution connects those conversions to the campaigns and touchpoints that influenced them. Thus, showing which campaigns acquire funded traders, what they cost, and what traders do after converting.
💡For a broader look at reaching and acquiring traders, read our guide to prediction market advertising.
Why Measuring Prediction Market Campaigns Is Hard
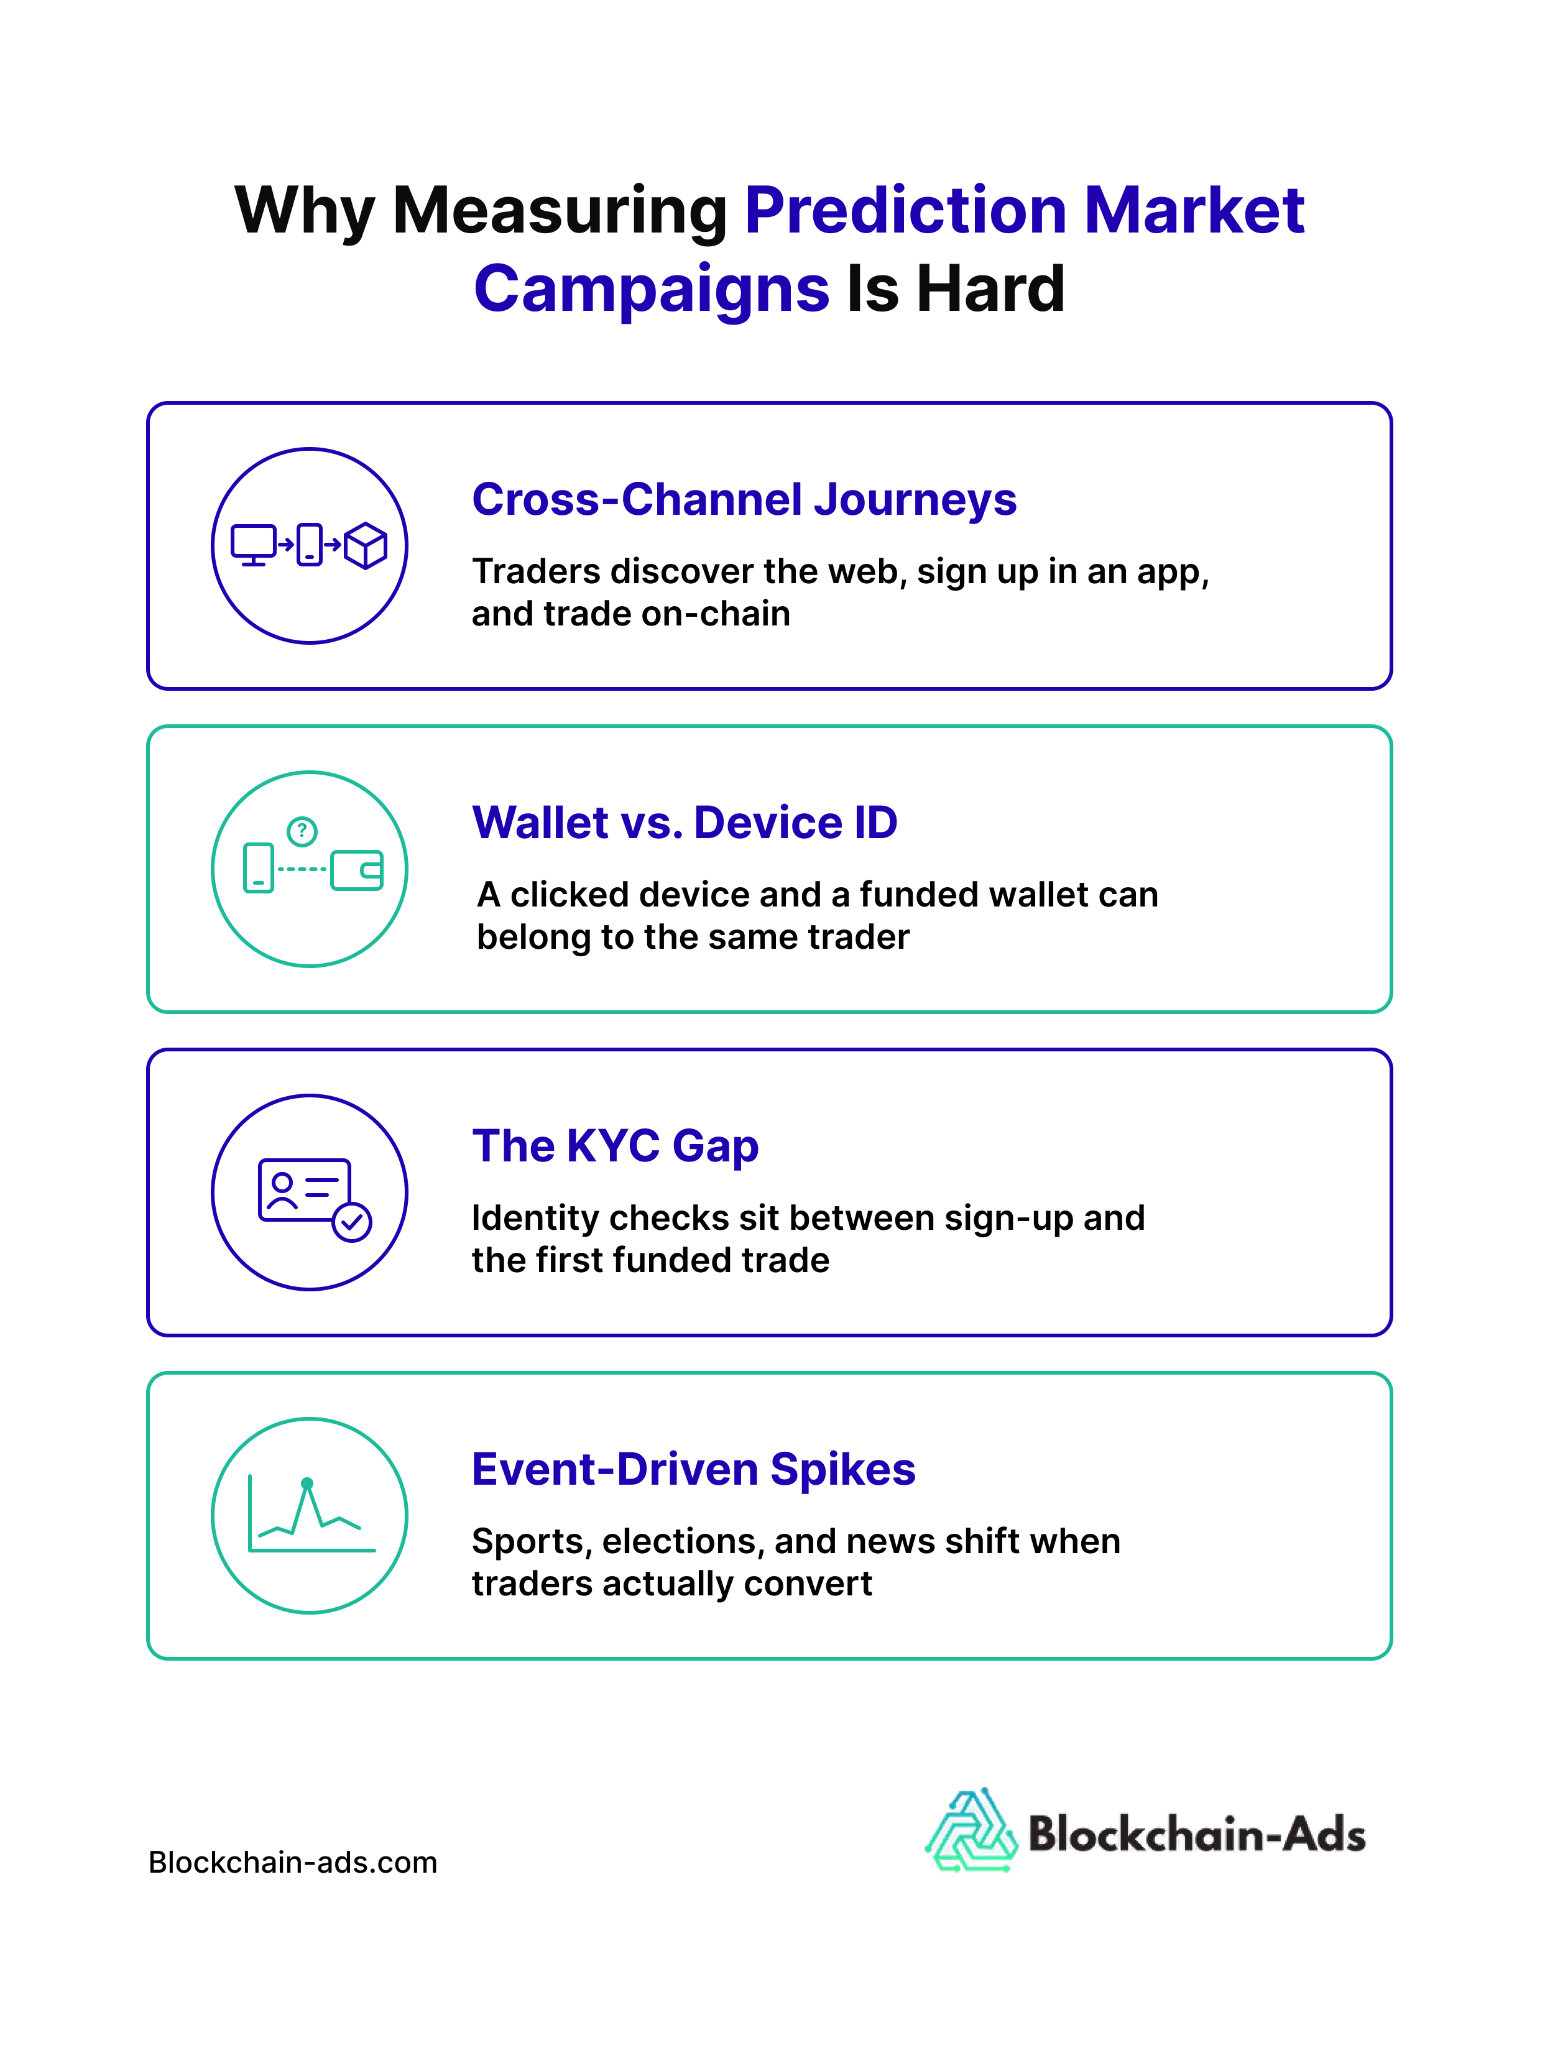
Prediction market attribution gets complicated because the trader journey rarely happens in one place or in one session. Here are the key challenges that make prediction market campaigns difficult to measure:
Traders Move Across the Web, In-App, and On-Chain
A trader might discover an ad on the web, sign up through an app, and later fund their account or trade on-chain. These different environments can disconnect the original campaign interaction from the conversion.
For example, Google Ads defines cross-device conversions as cases where someone interacts with an ad on one device and converts on another. If those interactions cannot be matched to the same trader, attribution can undercount conversions or assign them to the wrong source.
Accurate prediction market campaign tracking therefore depends on recognizing the same trader across these touchpoints.
Wallet Identity vs. Device Identity
A device ID identifies the browser or device that interacted with an ad, while a wallet address records activity tied to a blockchain wallet. For on-chain prediction markets, both can represent different parts of the same trader journey.
Matching them is the challenge. A marketer might know that a device clicked an ad and a wallet was later funded or traded without knowing whether they belong to the same trader.
For example, Blockchain-Ads maps hashed device identifiers and wallet addresses to the same anonymous ID when a wallet connection is available. This links the off-chain campaign interaction with on-chain activity.
The KYC Gap Between Sign-up and Funded Trade
A sign-up confirms registration; funding and placing a trade are separate steps that still have to happen. On regulated prediction markets, identity verification sits between registration and trading, adding another stage to the prediction market user acquisition strategy.
For instance, Kalshi requires traders to complete identity verification to meet its regulatory requirements. Depending on the verification process, additional information may also be required before an account is approved.
Cost per sign-up therefore captures only registration. Tracking KYC completion, funding, and first trades shows how many acquired traders progress further and where they drop off.
Event-Driven Spikes Distort Attribution Windows
Prediction market demand can change sharply around sports fixtures, elections, economic announcements, and breaking news. This makes the time between an ad interaction and trade less predictable.
According to Reuters, prediction markets recorded $3.17 billion in trading volume on Saturday during the opening weekend of the 2026 NFL season. Sunday added another $3.12 billion.
A short attribution window can miss traders who convert when the event becomes relevant. A window that runs too long can credit an earlier campaign for trades driven more by the event itself.
Attribution windows therefore need to reflect both conversion lag and the timing of the promoted event. With these challenges in mind, the next step is deciding which metrics give the clearest picture of campaign performance.
What to Measure: The Metrics That Matter
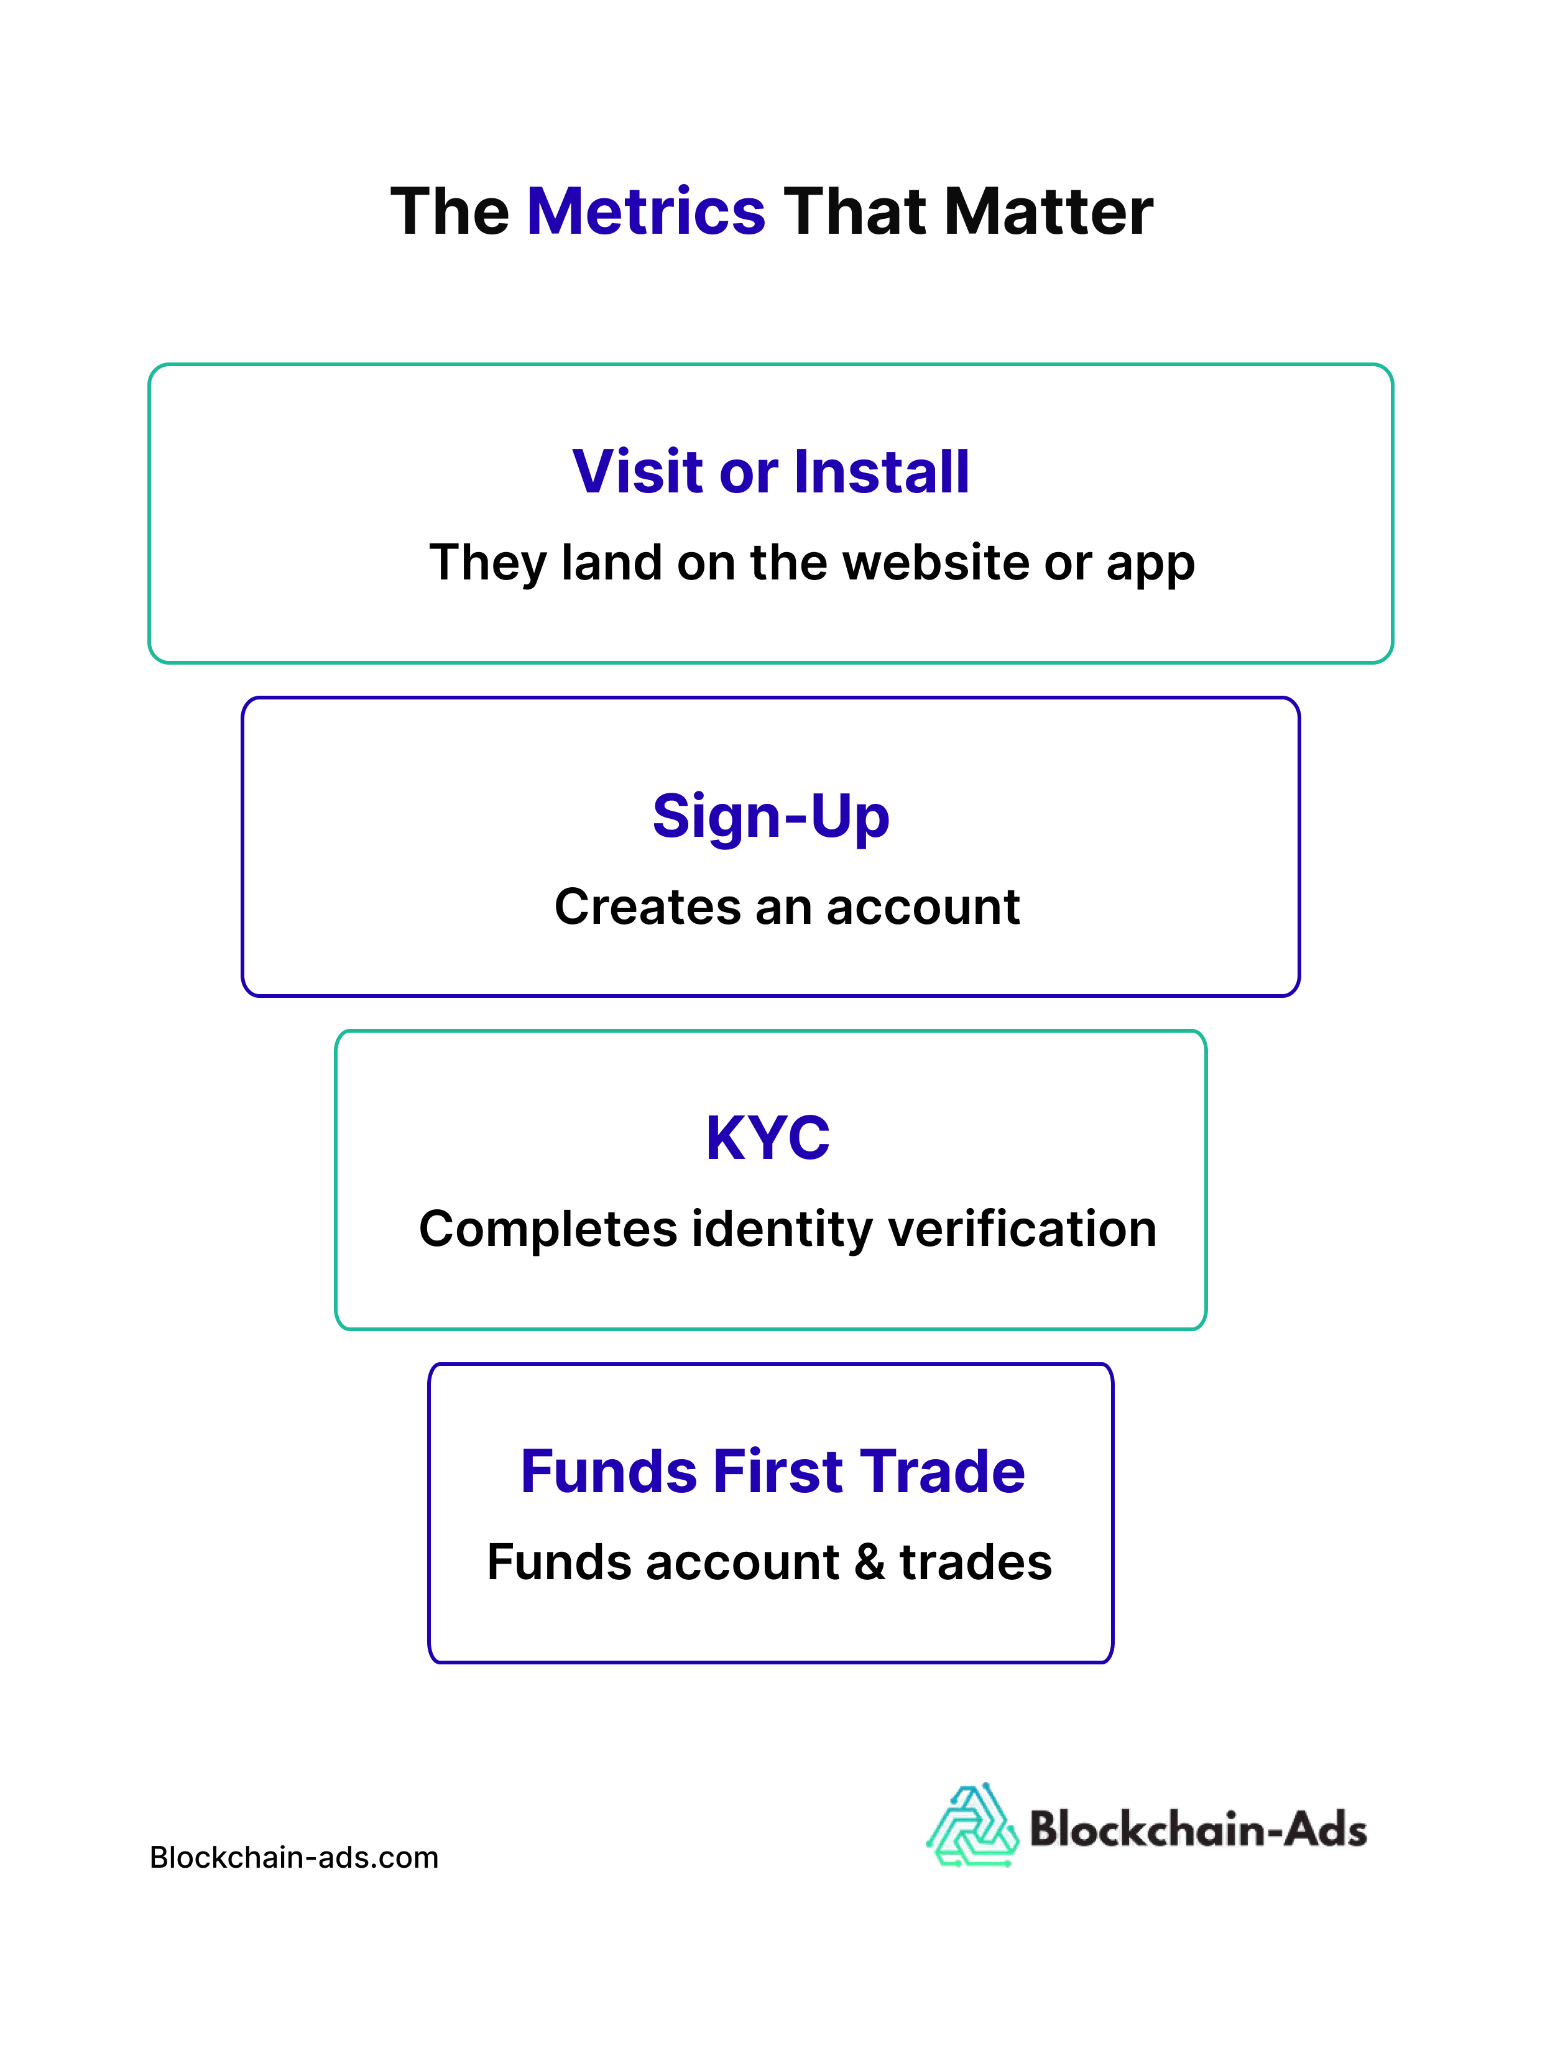
A useful measurement framework should answer two questions: Is the campaign acquiring traders efficiently, and what is driving that performance?
That requires combining commercial metrics with conversion data from each stage of the trader journey. Here’s what to measure:
CAC, LTV, and the LTV:CAC Guardrail
Customer acquisition cost (CAC) measures how much you spend to acquire a trader. But its usefulness depends on what counts as acquisition. A sign-up, verified account, and funded trader represent different stages.
Lifetime value (LTV) shows how much value acquired traders generate over time. Looking at both prevents a low acquisition cost from appearing successful when those traders generate little value.
The LTV:CAC ratio acts as a guardrail for scaling. Stripe cites 3:1 or higher as a generally accepted benchmark, though prediction market operators should treat it as a reference rather than an industry-specific target.
💡See our prediction market statistics guide for more industry benchmarks and market data.
Funnel Events: Visit or Install, Sign-Up, KYC, Funded First Trade
Track each funnel event separately to see how many traders progress:
- Visit or install: Reaches the website or installs the app.
- Sign-up: Creates an account.
- KYC: Completes identity verification.
- Funded first trade: Funds the account and places the first trade.
Stopping at sign-up can make acquisition look stronger than it is. For instance, Blockchain-Ads recorded 2,210 registrations at $13.57 each for Dexsport, but only 110 first-time depositors at $272.73 each.
Tracking each stage reveals where traders drop off and how acquisition costs change deeper in the funnel. A strong sign-up rate can still produce weak funded-trader acquisition if traders leave during KYC, funding, or before their first trade.
The Conversion Event Follows the Campaign Goal
Choose the primary conversion event based on the campaign goal. A sign-up campaign should optimize for registrations, while a funding campaign should optimize for funded accounts.
Google Ads separates these roles through primary and secondary conversions. Primary conversions guide bidding, while secondary conversions remain available for reporting and analysis.
Marketers can therefore optimize towards the campaign goal while using the remaining funnel data to diagnose performance. Now that you know what counts as a conversion, the next question is how to attribute it.
Attribution Models for Prediction Market Campaigns
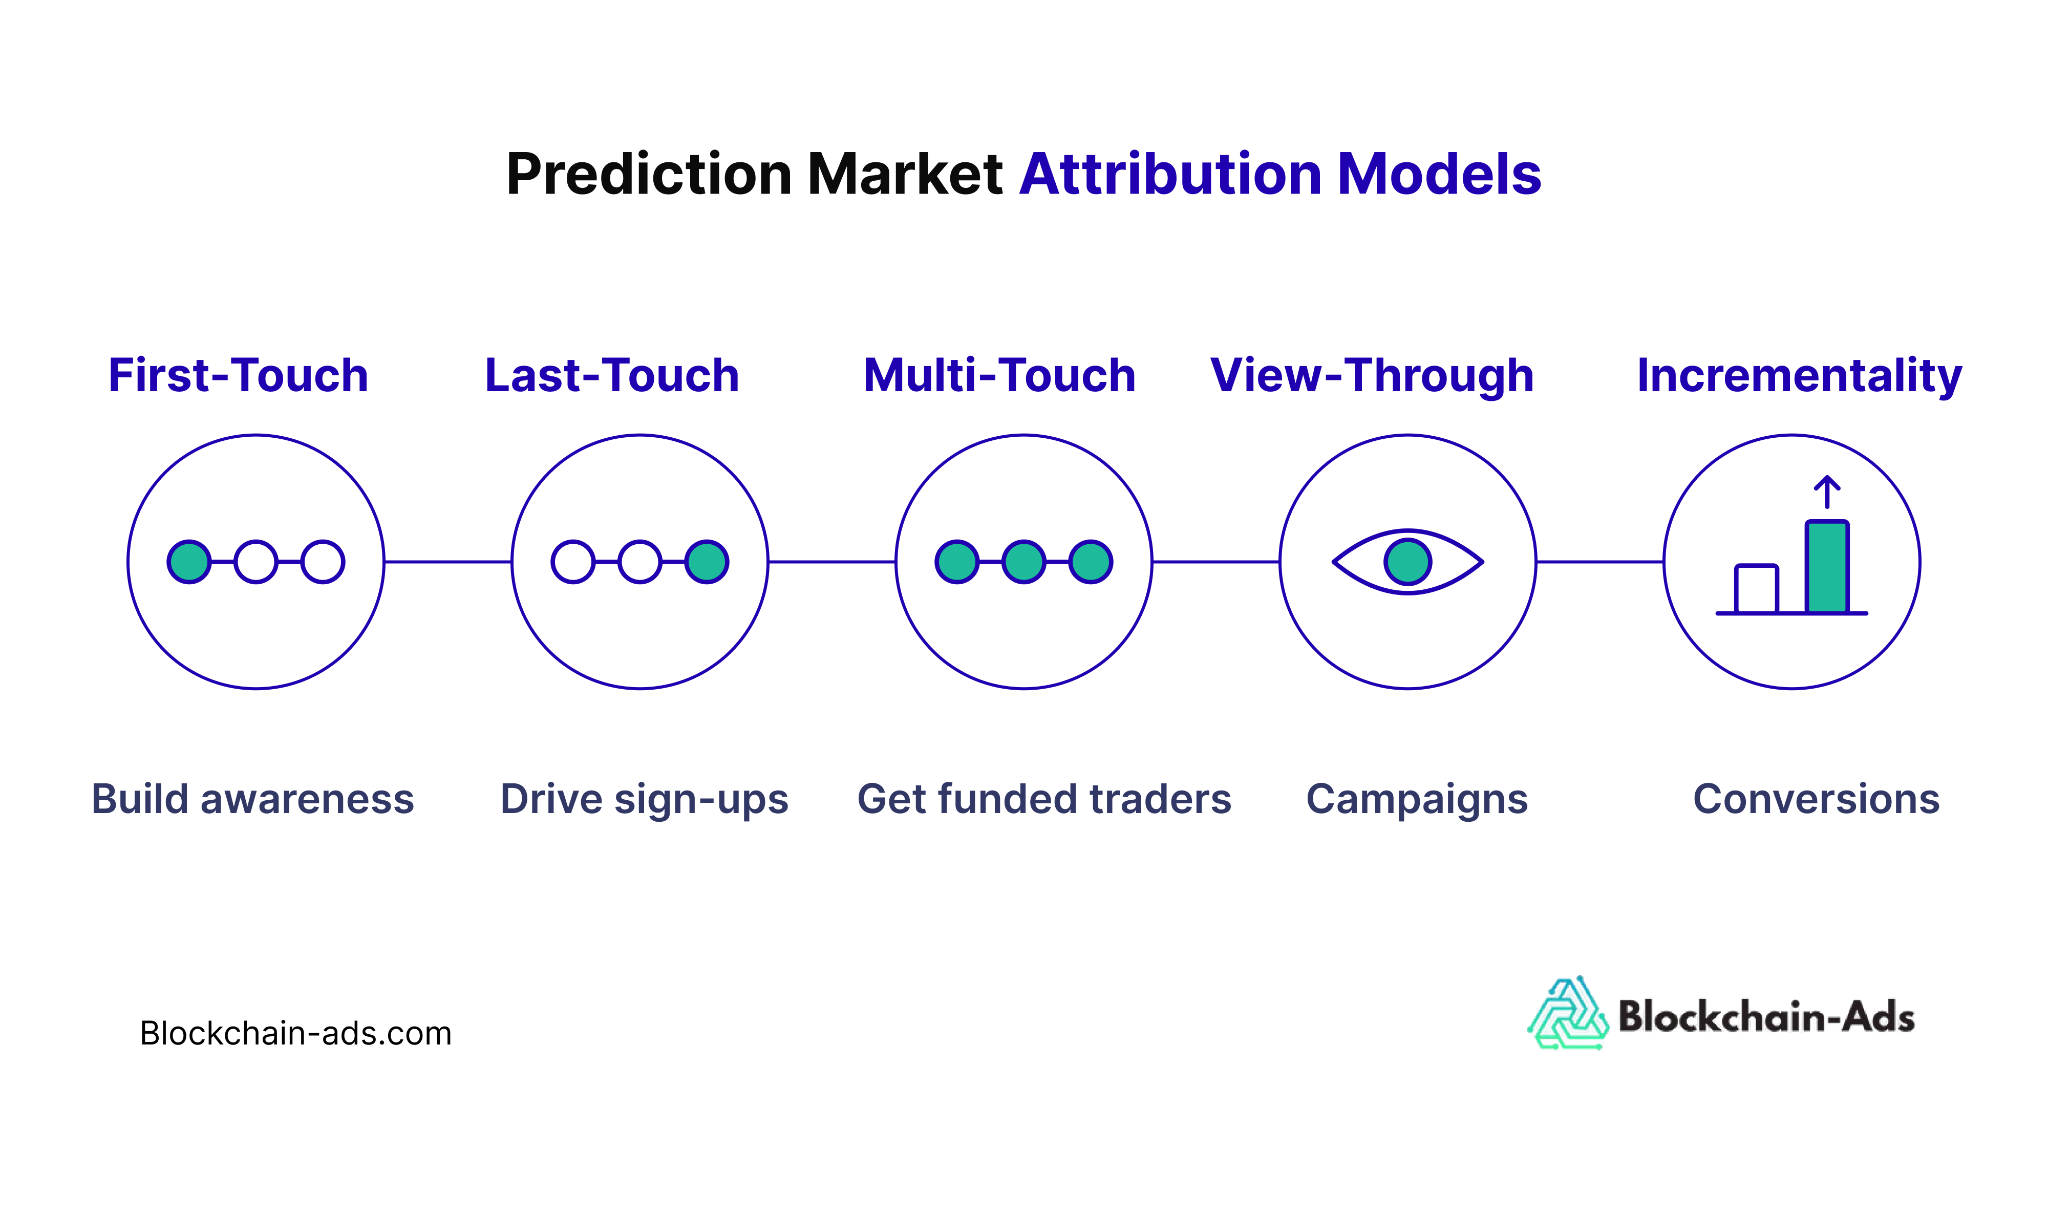
An attribution model decides how much credit each marketing touchpoint receives for a conversion. The model you choose can change which campaigns, channels, and creatives appear to drive performance.
Here are five attribution models to consider for prediction market campaigns:
First-Touch and Last-Touch
First-touch attribution gives full credit to the interaction that first brought the trader to the platform. Last-touch gives credit to the final interaction before conversion.
Say a trader discovers the platform through a display campaign, returns through paid search a few days later, and funds their account. The conversion would appear under a different channel depending on the model.
First-touch shows which campaigns introduce new traders, while last-touch identifies interactions closest to conversion. Neither shows the full journey: first-touch can understate later activity, while last-touch can over-credit lower-funnel campaigns.
Multi-touch
Multi-touch attribution distributes conversion credit across multiple marketing touchpoints.
For example, a trader might discover a prediction market through a display ad, later see a retargeting ad, and deposit through paid search. A linear model would split credit equally across all three, while a data-driven model assigns credit based on each touchpoint’s estimated contribution.
This provides a broader view when traders move through several touchpoints before sign-up, KYC, funding, and their first trade.
View-Through (Display, Native, CTV)
Not every ad generates a click, especially across the display, native, video, and CTV formats available through prediction market advertising platforms.
View-through attribution connects a later conversion to an earlier impression. For instance, Google Ads records a view-through conversion when someone sees an eligible ad, does not interact with it, and later converts.
The attribution window matters. A longer window captures more delayed conversions but increases the chance of crediting an impression that had little influence.
Pro tip: Report view-through and click-through conversions separately to distinguish the role of viewed ads from clicked ads.
Incrementality Testing
Incrementality testing asks whether the campaign generated conversions that would have happened without the advertising. This matters when a major sports fixture, election, or economic announcement drives organic demand alongside the campaign.
Teams can compare an exposed group with a comparable holdout group. The difference in funded traders or first trades estimates the additional conversions generated by the campaign.
But which model makes sense for your campaign? Let's find out.
Which Model Fits Which Goal
Match the attribution model to the decision you need the campaign data to support.
💡Learn more about planning and buying media in our prediction market media buying guide.
The Tracking Gaps That Break Your Data
Even with the right attribution model, gaps in prediction market conversion tracking can distort the results. Conversions can disappear, show up under the wrong source, or receive credit that does not reflect how the trader converted.
Three gaps deserve particular attention:
Cross-Device and Web-to-App
Consider this journey: a trader can click an ad on a desktop, open the platform on their phone later, and complete KYC or fund their account in the app. If those interactions cannot be matched, the journey breaks into separate sessions, and the original campaign can lose credit.
Microsoft identifies cross-device attribution as difficult because the same user can appear under different identifiers across devices. For prediction market marketers, this can make a campaign appear to generate traffic or sign-ups without capturing the funded traders it acquired.
Signal Loss and the Cookieless Path
Browser and privacy controls create uneven tracking across the audience. Chrome held 69.4% of worldwide browser usage in August 2026, while Safari accounted for 15.8%, and each handles cross-site tracking differently:
- Safari: WebKit blocks third-party cookies by default and limits other forms of cross-site tracking.
- Firefox: Total Cookie Protection confines cookies to the site where they were created.
- Chrome: Google gives users a choice over third-party cookies, while Incognito mode blocks them by default.
Consent choices, cookie deletion, and identifier expiry can remove further signals before a trader completes KYC, funds an account, or trades. Campaign reports may then lose the original acquisition source or attribute the conversion to a later interaction.
Event-Window Distortion
Event-window distortion occurs when the attribution window does not match how long traders take to convert.
Too short: A trader completes KYC, funds the account, or trades after the window closes, so the campaign receives no credit.
Too long: A trader sees an election campaign but trades weeks later after a major polling update. The campaign may receive credit even though the update prompted the trade.
For instance, AppsFlyer uses a seven-day default window for click-through attribution and a one-day window for view-through attribution, showing how periods can differ by interaction type.
Note: Choose a window that captures genuine campaign conversions without claiming those driven by something else.
The Fix: Server-Side and First-Party Tracking
Server-side tracking sends verified conversion events from your backend, while first-party tracking keeps campaign identifiers and conversion data within systems you control.
A simple setup works like this:
- Capture the campaign or click ID when a trader arrives from an ad.
- Store it with the trader record through sign-up and KYC.
- Send the conversion event with the matching ID when the backend confirms funding or a first trade.
Blockchain-Ads server-to-server tracking passes a unique click ID from the campaign interaction to the reported conversion and can include transaction value for revenue tracking.
Server-side and first-party tracking do not eliminate every identity or consent gap. But they reduce dependence on browser signals and help connect confirmed conversions to the original campaign.
How to Build Your Measurement Framework
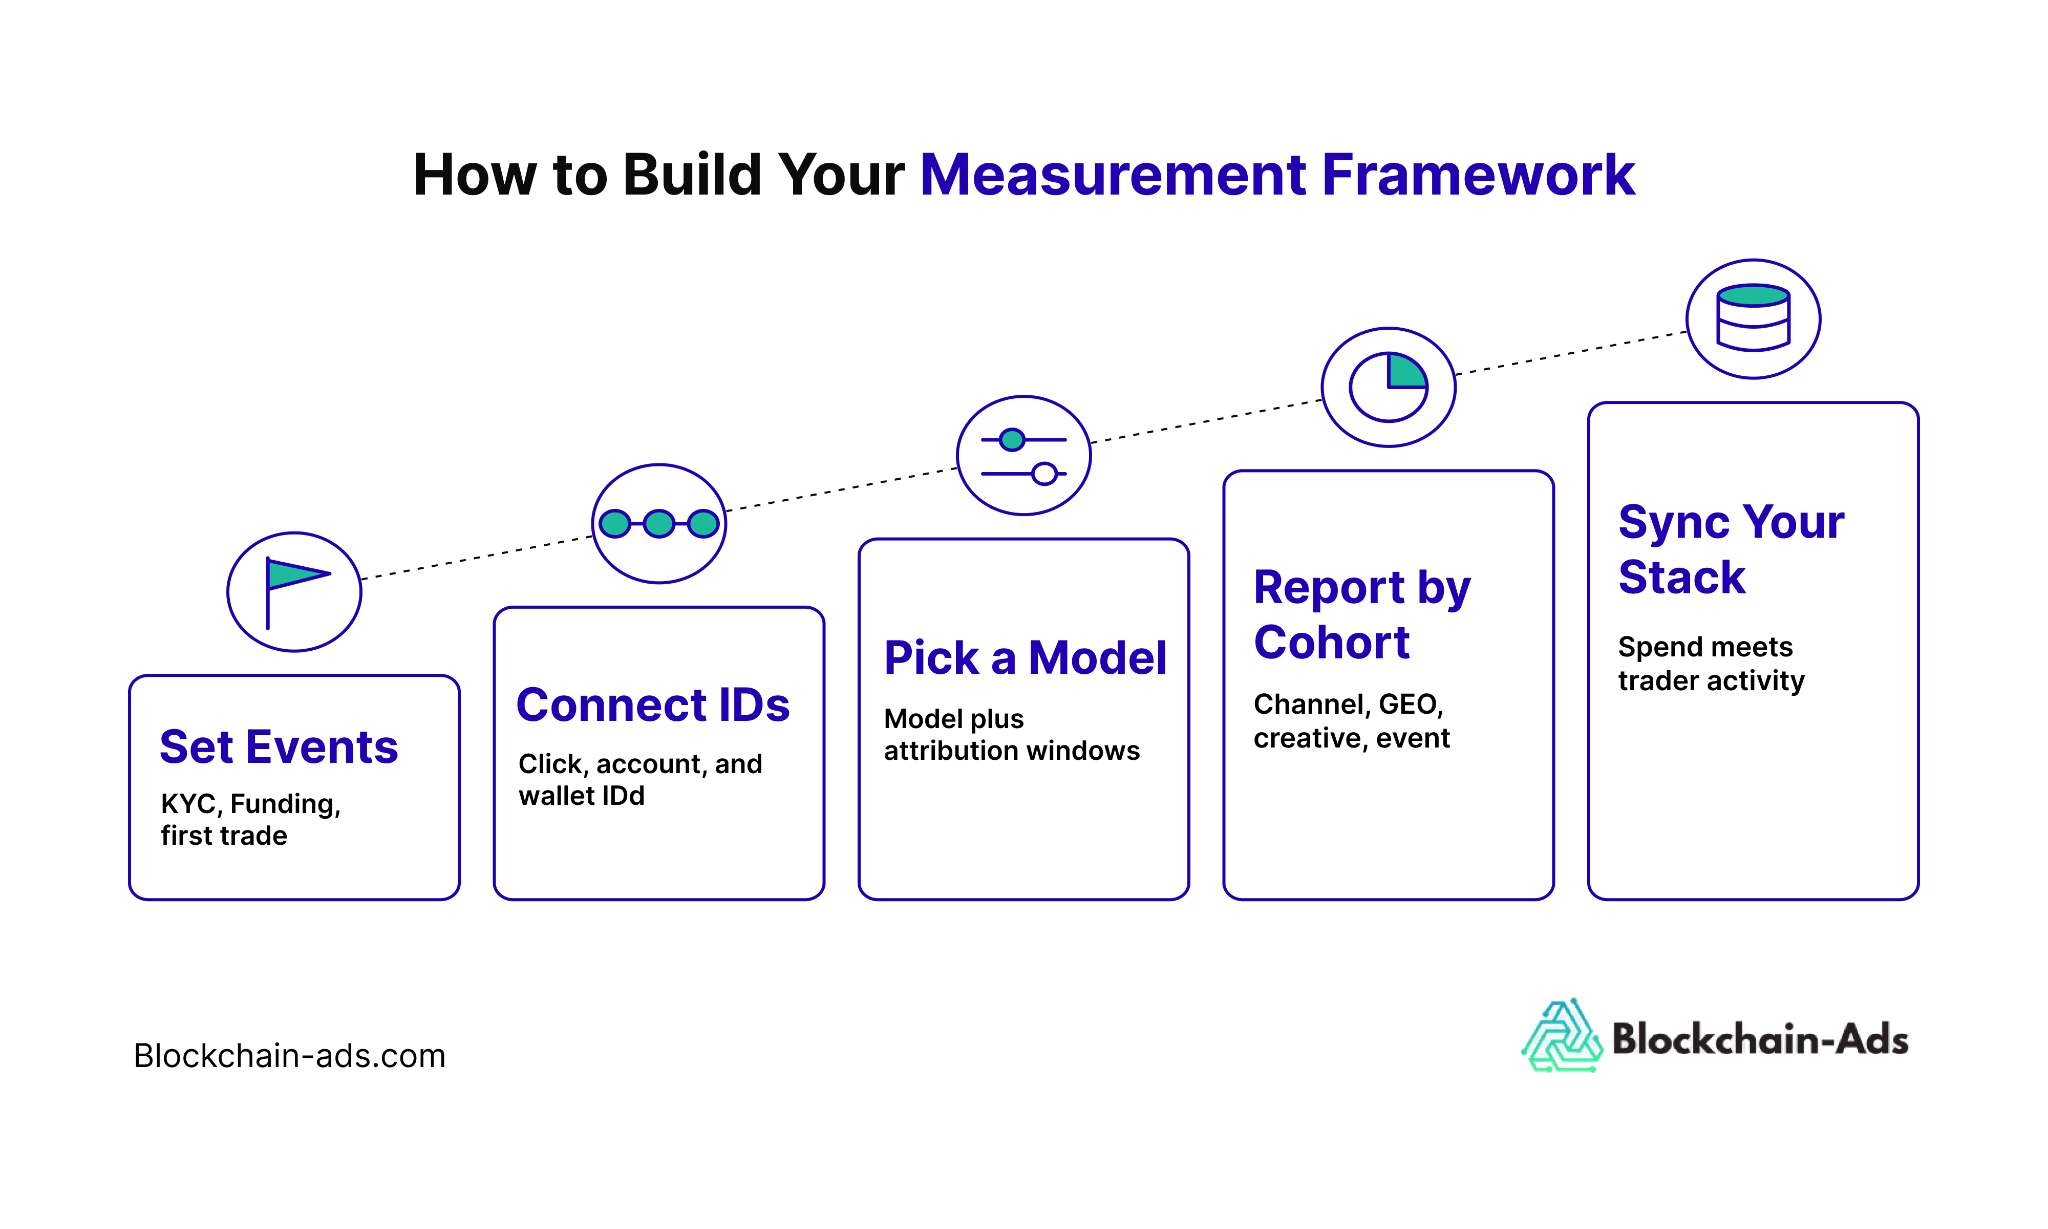
A useful measurement framework should answer one question clearly: Which campaigns are driving the results that matter?
Follow the steps mentioned below to build an efficient measurement setup:
1. Set Conversion Events Along the Journey
Choose conversion events that match the campaign goal. An acquisition campaign might optimize for KYC approval, while a campaign focused on active trading could use a funded first trade. For retention, it could be a repeat trade or trading value.
Define exactly what triggers each event. For a first trade, that could be when the trader places an order, executes it, or crosses a minimum trade value. Keep the event name, trigger, and timestamp consistent across campaign reporting, product analytics, and finance systems.
2. Connect Every Touchpoint
Capture the campaign or click ID when the trader arrives and connect it with the identifiers needed later:
- Account ID for sign-up, KYC, funding, and trade activity.
- Attribution ID when the journey moves from web to app.
- Wallet ID, where wallet activity forms part of the journey.
Device switching, consent choices, and privacy controls can still create gaps, but connecting available identifiers preserves the path from campaign interaction to trader activity.
3. Choose the Model and Attribution Windows
As discussed earlier, match the attribution model to the campaign goal. Use first-touch for discovery and last-touch for the interaction closest to conversion. Adopt multi-touch when several channels contribute, and view-through reporting for impression-led formats such as display, native, video, and CTV.
Then set separate windows for clicks and impressions. Use your time-to-conversion data to see how long traders take to reach sign-up, KYC, funding, or first trade, and set the window accordingly. Keep click-through and view-through results separate, and use the same settings when comparing similar campaigns.
4. Report by Cohort: Channel, Audience, Creative, GEO, and Event
Next, break down prediction market ad reporting to see where performance actually comes from. A single CPA can hide a campaign that generates cheap sign-ups but few funded traders.
Look beyond the cheapest acquisition cost. An audience that costs more to acquire may deliver more funded traders who continue trading over time.
5. Export or Connect to Your Reporting Stack
Bring campaign data and trader activity into your reporting tools so you can compare spend with what traders do after acquisition.
Bring together:
- Campaign data such as spend, clicks, campaign ID, creative ID, and audience.
- Trader activity, including sign-up, KYC, funding, first trade, and repeat trading.
- Value data such as deposit value, trading value, or revenue.
- Attribution data including click ID, source, model, and attribution window.
Blockchain-Ads integrates with measurement and attribution tools, including AppsFlyer, Keitaro, Voluum, Google Analytics, and Mixpanel.
Before testing prediction market ad campaigns, run a test conversion through the full setup. Check that the campaign identifier carries through and the conversion appears correctly across your systems.
With conversion events, touchpoints, attribution rules, and reporting aligned, you can trace performance from campaign spend to trader activity.
How Blockchain-Ads Measures Prediction Market Campaigns
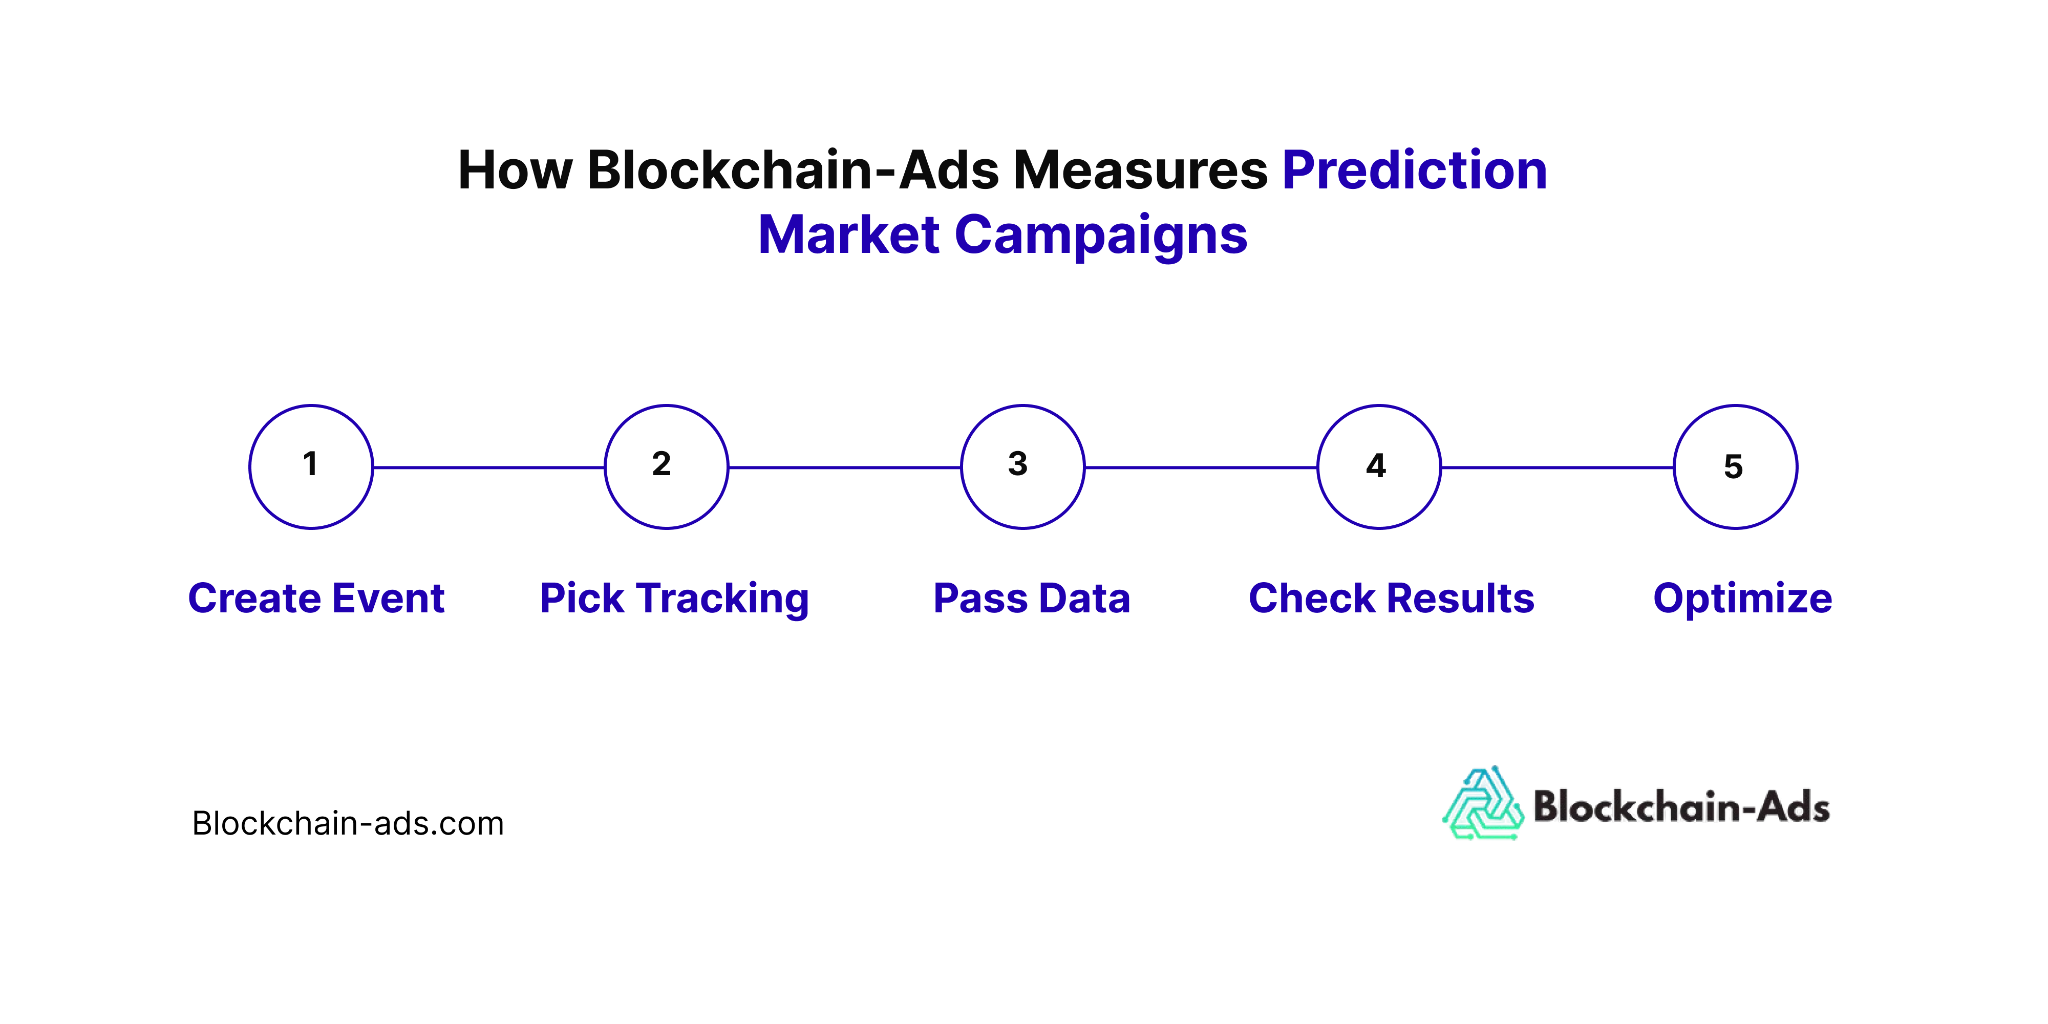
Blockchain-Ads connects campaign clicks to the conversion events you choose to measure. Here’s what the setup looks like:
1. Create the Conversion Event
In the Blockchain-Ads HUB, create a separate conversion for the action you want to measure, such as a sign-up or first deposit.
For each conversion, set:
- Conversion name
- Conversion category
- Tracking method
2. Choose How You Want to Track It
Blockchain-Ads supports three tracking methods:
- Manual pixel: Install the Blockchain-Ads pixel on the relevant page.
- Google Tag Manager: Trigger the conversion through GTM.
- Server-to-server: Send the conversion directly from your server.
For S2S tracking, Blockchain-Ads passes a unique {clickid} with the campaign click. Your system stores it and sends it back when the conversion happens, connecting the conversion to the original campaign interaction.
3. Pass the Data You Need
Along with the conversion, advertisers can pass:
- Transaction Value for revenue and ROAS measurement
- Wallet ID when wallet-level data is relevant
These fields add more context to the conversion without changing the basic event count.
4. Check the Campaign Results
Blockchain-Ads reporting brings conversion data back alongside campaign performance. Advertisers can then see which campaign activity is generating the conversions they chose to measure.
5. Use Those Conversions for Optimization
The same conversion data can feed campaign optimization, so performance can be evaluated against the chosen campaign objective rather than stopping at impressions or clicks.
Common Measurement Mistakes
Here are five common measurement mistakes that can distort campaign performance:
- Relying on last-click alone can hide channels that introduced or assisted traders earlier.
- Using the wrong attribution window can miss genuine conversions or credit a campaign for trades driven by a later event.
- Ignoring view-through conversions can undervalue display, native, video, and CTV campaigns.
- Optimizing for the wrong conversion event can make cheap sign-ups look successful even when few traders fund or trade.
- Comparing campaigns with different attribution settings can make performance differences look bigger than they really are.
The same data also tells you what to optimize and where to scale. If one target audience brings in more funded traders, one creative improves KYC completion, or one channel delivers stronger LTV, you know where the better opportunities are.
As you increase spend, watch whether those results hold or start to drop.
Know What to Optimize and What to Scale
Your first campaigns give you something future campaigns do not have: a baseline. Once you know your normal CAC, KYC completion rate, funded-trader rate, and trader value, changes in performance become much easier to spot.
That baseline also makes scaling less of a guess. You can see whether adding budget is bringing in more valuable traders at similar economics or simply increasing volume at a higher cost.
If you want to take action, apply to advertise on Blockchain-Ads and discuss your campaign goals and performance metrics during the qualification process.
Srijan Sharma is a B2B writer specialising in SaaS, FinTech, MarTech, and data integration.
View full profile →