75+ iGaming Statistics for 2026: Market Size, Revenue, Growth & Trends

The global iGaming market keeps growing in 2026, so putting one exact number on its size is not that easy.
Different researchers measure online gambling, sports betting, casinos, and adjacent verticals differently, producing estimates that can be billions apart.
For example, one estimate puts the online gambling market size at $97.7 billion in 2026, while a forecast puts it at $655 billion for the same year.
As a leading DSP platform in the iGaming industry, Blockchain-Ads has mapped the latest iGaming statistics across global markets, verticals, and advertising. Every market figure is linked to the source behind it.
Top iGaming Statistics for 2026

Here are some of the most important numbers shaping the iGaming market in 2026:
- The global online gambling market is estimated at $97.7 billion in 2026 by Grand View Research.
- Statista projects total global gambling revenue at $655.31 billion in 2026, using a broader gambling-market definition.
- The US commercial iGaming market exceeded $10 billion in 2025.
- Europe generated €47.9 billion in online gambling GGR in 2024, equal to 38.8% of the regional gambling market.
- US commercial sportsbooks accepted $166.94 billion in handle and generated $16.96 billion in GGR in 2025.
- The global online casino market is forecast to reach $23.9 billion in 2026.
- Blockchain analytics recorded $51 billion in on-chain gambling volume in 2025; it is not operator revenue or total gambling handle.
- Mobile devices produced 58% of European online-gambling revenue in 2024, with a 67% share projected for 2029.
- In Asia-Pacific, sports betting held 46.3% of online-gambling revenue in 2025, compared with 38.7% for casinos.
- Social casino is estimated at $9.06 billion in 2026, while mobile apps accounted for 71.85% of its 2025 revenue.
iGaming Market Size, Growth & Market Share Statistics
The size of the iGaming market is significantly influenced by how researchers define online gambling. The most cautious estimates suggest the market is approximately $100 billion, while more inclusive approaches indicate figures exceeding $200 billion.
Global market size
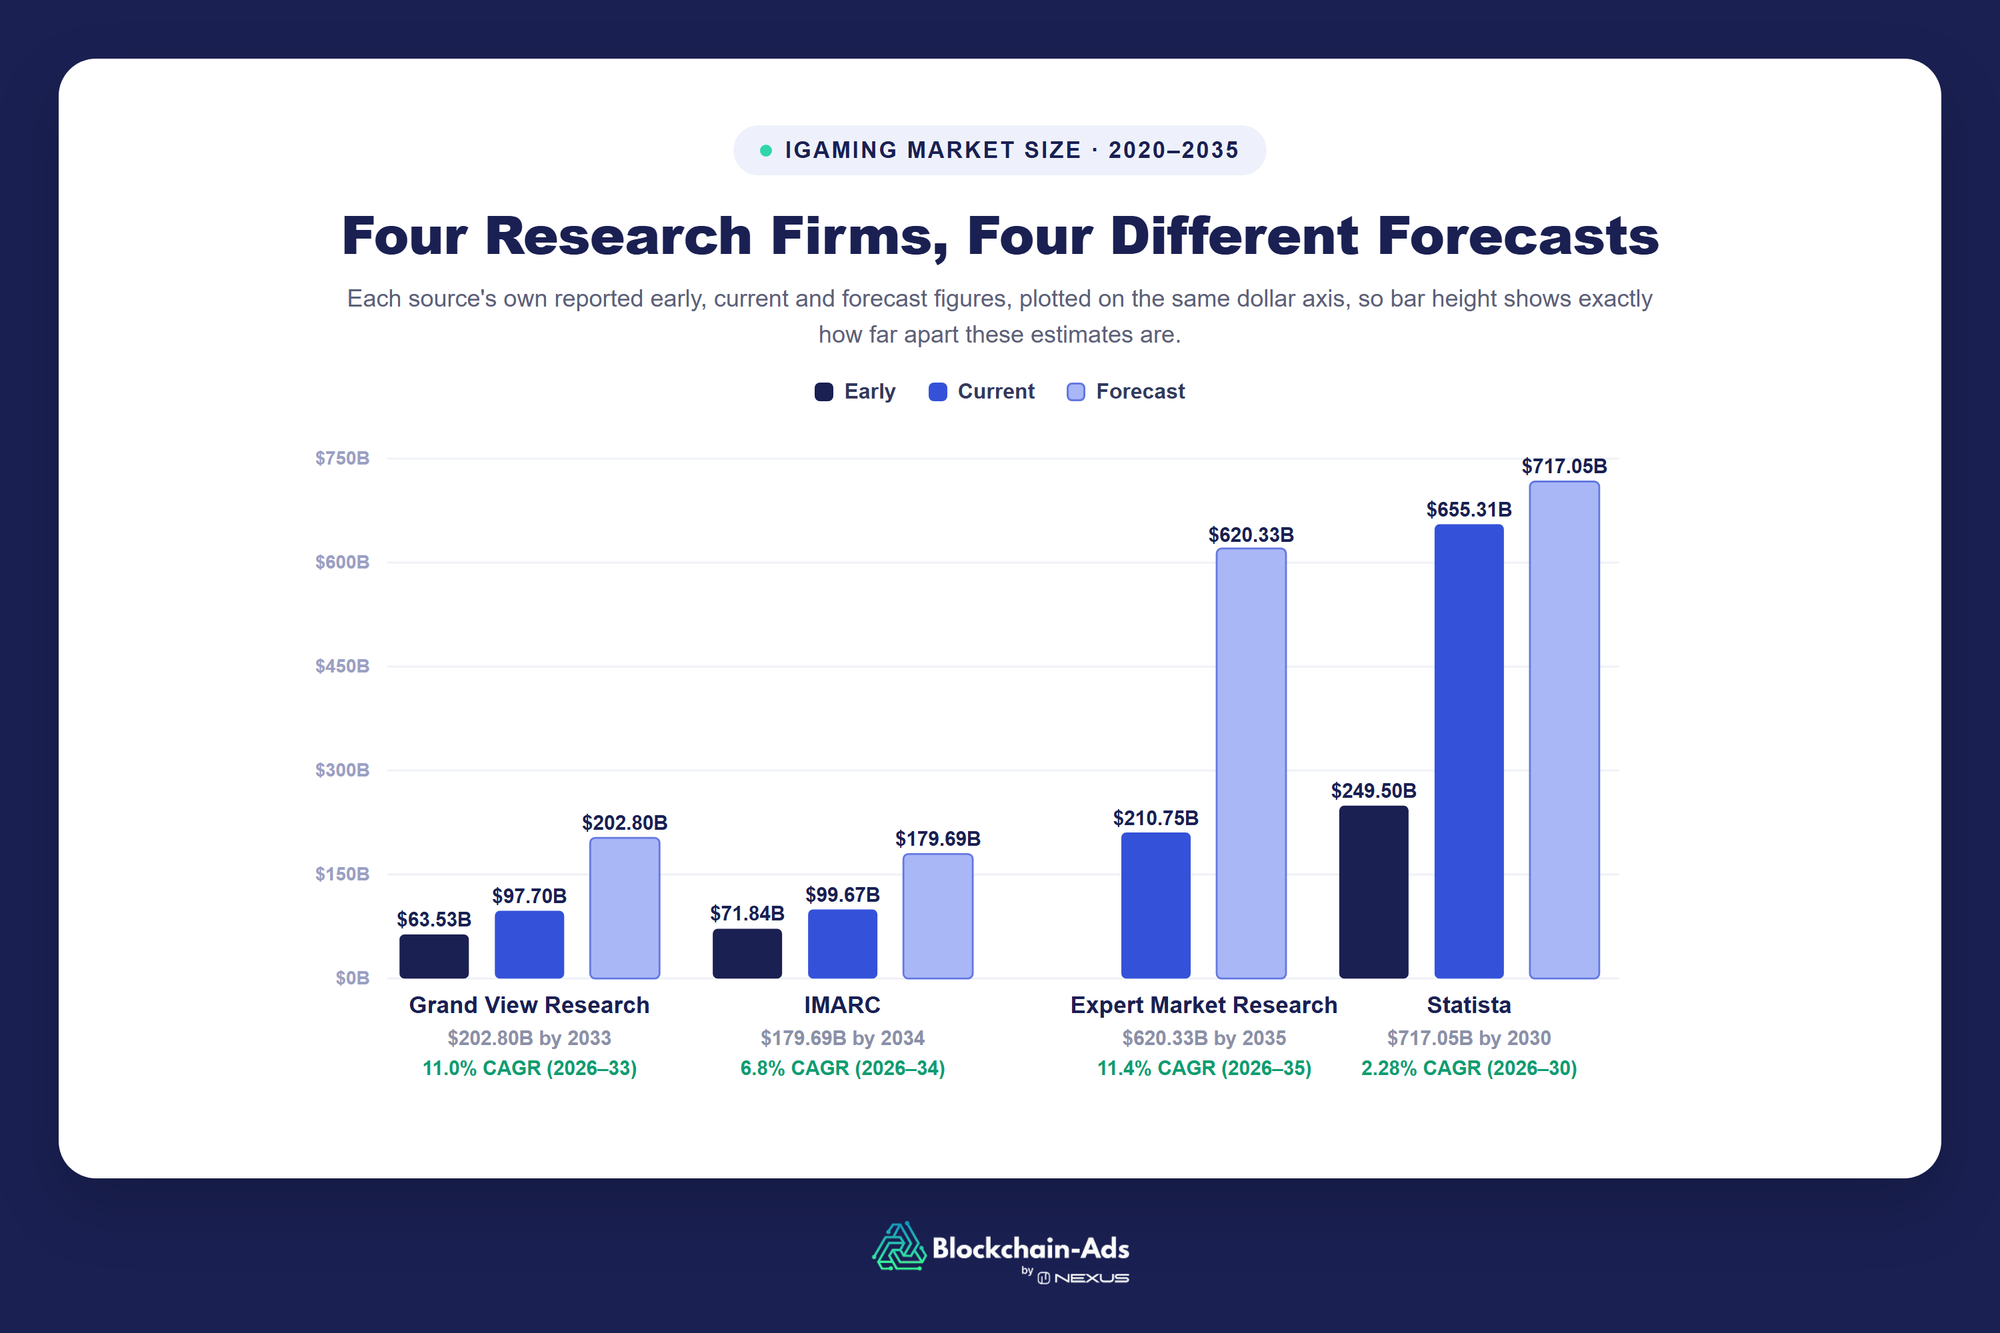
Grand View Research values the global online gambling market at $97.7 billion by 2026. Expert Market Research gives a much larger figure, as its model values the market at $210.75 billion in 2025 and forecasts $620.33 billion by 2035.
IMARC is closer to the GVR estimates, placing the online gambling market size at $99.7 billion in 2025, broadly above $100 billion by 2026, and its forecast reaches $179.7 billion by 2034.
Furthermore, the projections by Statista show the global gambling market size will reach a stunning $655.31 billion in 2026.
Sources: Grand View Research, IMARC, EMR, Statista.
The reason estimates vary is because "iGaming" isn't strictly defined. Sources disagree on what counts as igaming, like lotteries, social casinos, retail betting linked to online platforms, and offshore operators. That’s why each report ends up measuring a slightly different market.
For example, Statista values the total global gambling market, including both land-based and online activity. In fact, it’s estimated that online casino gaming accounts for 58%, compared to 42% land-based gambling.
Growth and CAGR

The iGaming CAGR is basically the pace by which the market size is expected to grow yearly. In the US market alone, the annual change in iGaming growth was estimated at 14.7% GGR in May 2026.
According to Statista, worldwide gambling revenue is expected to show an annual growth rate (CAGR 2026-2030) of 2.28%. Furthermore, for sports betting alone, the market’s revenue is expected to show an annual growth rate (CAGR 2026-2030) of 4.79%.
Grand View Research currently forecasts 11% CAGR between 2026 and 2033 for online gambling. Expert Market Research forecasts an even higher 11.4% CAGR from 2026 through 2035. IMARC takes a more conservative position, evaluating the iGaming industry growth at 6.8% CAGR from 2026 through 2034.
Market share

The global iGaming market is represented by several key sectors in 2026, each having its place within the digital landscape. Online casinos hold about 52% of the industry revenue, followed by sportsbooks with a 35% share, and the rest is between poker, bingo, etc. According to Statista, in global comparison, most of the total gambling revenue in 2026 (~33%) will be generated in the US, and that would be about $216.85 billion.
In fact, the region is dominated by major operators FanDuel (Flutter) and DraftKings, which reportedly hold up to 60% (even up to 80% by other sources) of the entire US online gambling market, along with Bet365, Entain, BetMGM, and Stake taking up the rest.
The Flutter and DraftKings’ combined yearly market capitalization (GSC) exceeds $30.5 billion, while only their enterprise value is over $42.4 billion. Grand View Research reveals that Europe accounts for 41% of global online gambling revenue from 2025, yet Expert Market Research claims the share is up to 49.1%. Here, the sportsbook sector undoubtedly dominates the iGaming market as the largest revenue contributor in 2025, with a share of 53.62%.
iGaming Statistics by Region
The regulatory changes keep bringing new major markets like Brazil to the global iGaming arena, as only in Q1 2025 did it generate over $3.3 billion in revenue.
United States

The U.S. commercial gaming industry earned $1.03 billion from iGaming in May 2026, up 14% from May 2025, according to the American Gaming Association. The quarterly revenue of $5.07 billion in Q1 2026 showed a 18.3% increase in comparison to Q1 2025.
iGaming revenue in seven US states with legalized online gambling exceeded $10 billion in 2025, although three states (Michigan, New Jersey, and Pennsylvania) account for 90% of that.
Europe

According to EGBA, the total gambling market in Europe generated about €123.4 billion in 2024, with a 5% increase compared to 2023, while iGaming accounted for €47.9 billion (38.8%). It was estimated that the market would reach €54.8 billion by 2026, with a 6.9% CAGR (2024-2029).
The United Kingdom is considered by EGBA as the EU's largest online gambling market, accounting for over 36% of the entire European GGR in 2023. According to Grand View Research, the UK’s iGaming market generated $8.2 million revenue in 2025 and is estimated to reach $9.3 million in 2026 with 13% CAGR. IMARC evaluated the online gambling market in the UK by $9 billion in 2025, with an annual market growth rate at 4.21% throughout 2026-2034.
Latin America: Mexico and Brazil
Latin America as an iGaming market for now could be represented only by the two major regulated regions: Brazil and Mexico.
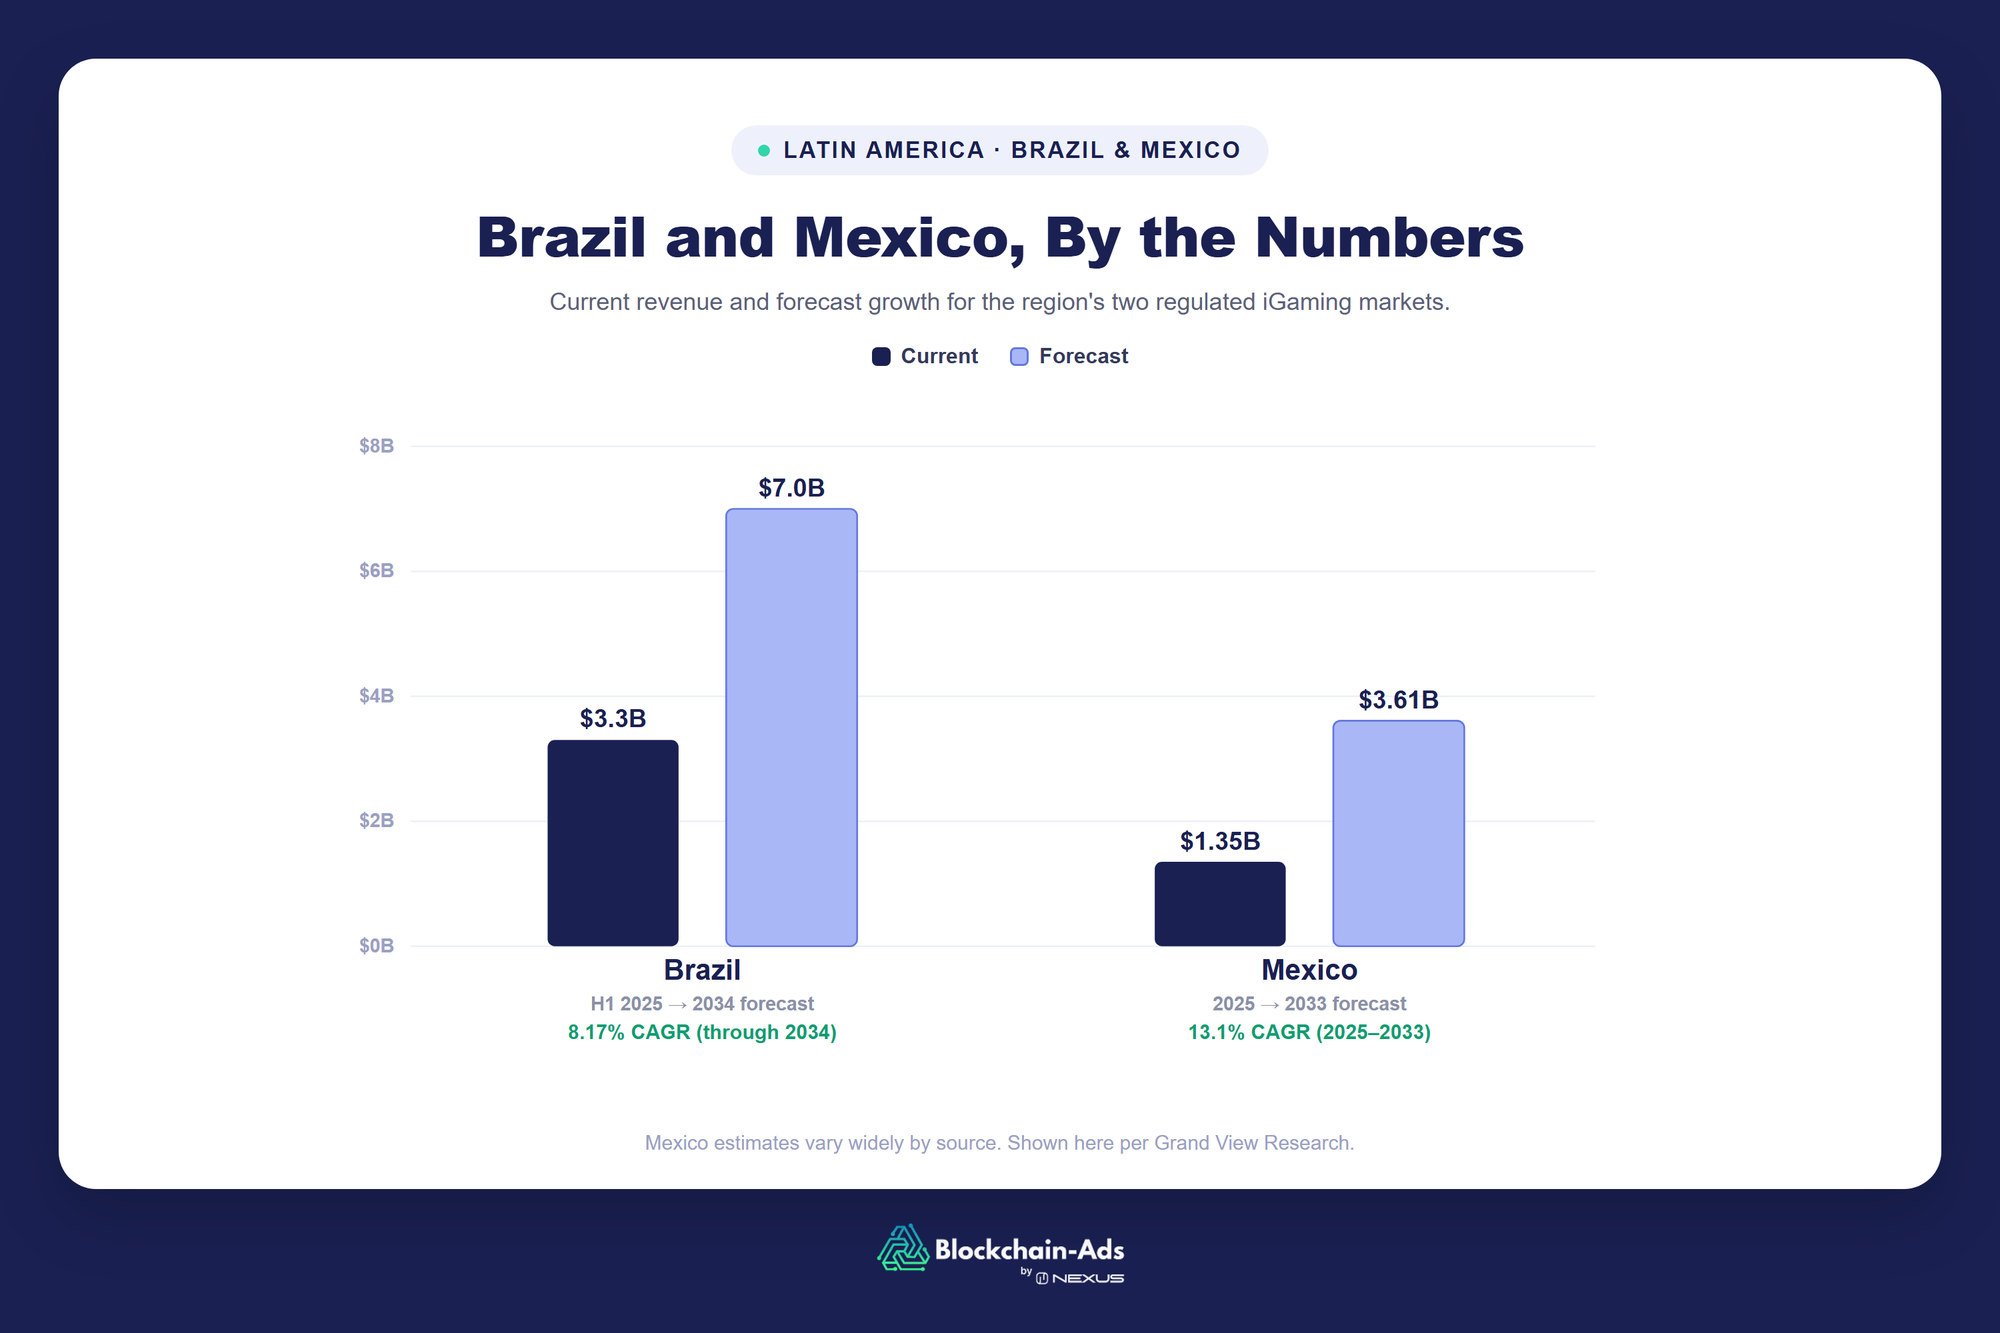
Brazil's online gambling market took off in 2025 as regulation kicked in, with gross revenue hitting R$17.4 billion (~$3.3 billion) in the first half of the year. The iGaming segment is projected to grow at an 8.17% CAGR through 2034, reaching $7 billion. Player acquisition costs run $50-$150 per casino FTD (median $90) and $40-$130 per sportsbook FTD.
Mexico's market is growing too, but estimates vary widely because much of it operates in a regulatory grey zone. Grand View Research puts 2025 revenue at $1.35 billion, growing to $3.61 billion by 2033 (13.1% CAGR). Research and Markets estimates just $790 million in 2025, reaching $1.09 billion by 2031 (8.6% CAGR). Neither figure is an official government number, they just reflect different views on how much of the unregulated market counts. Central Mexico alone accounts for 41% of Mexico’s iGaming activity.
Asia-Pacific
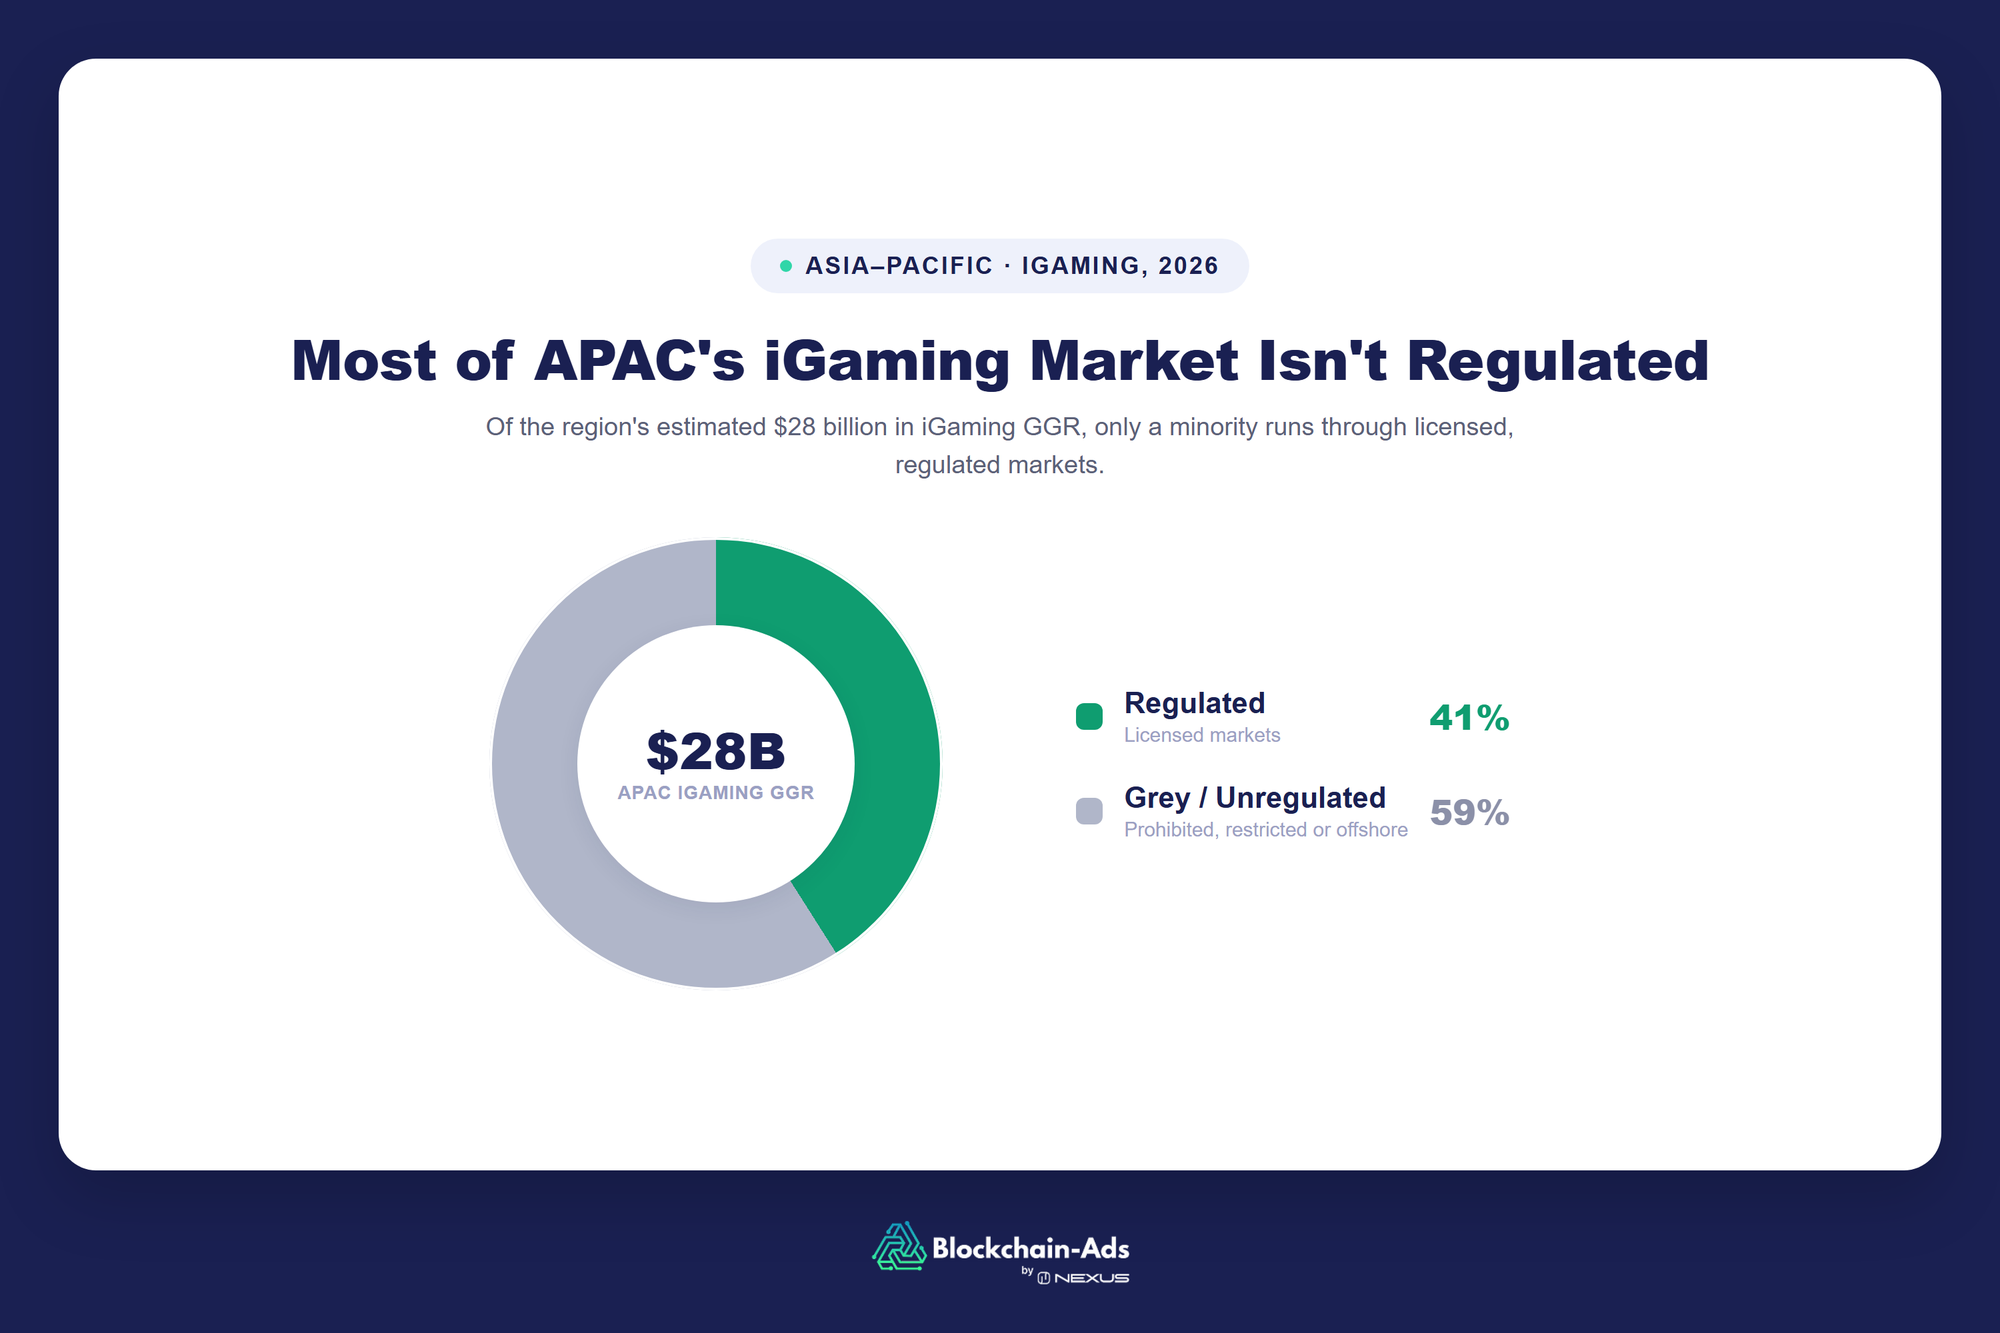
Asia-Pacific is the region where iGaming combines mature, licensed wagering markets with countries where online casinos are prohibited, severely restricted, or primarily supplied through offshore sites. IMARC values the APAC online gambling market at $26.11 billion in 2025 and projects $59.75 billion by 2034, at a 9.15% CAGR. It estimates sports betting as the largest vertical, with a 46.3% share, followed by casino at 38.7%.
The market becomes dark with the regulated/grey split. In 2026, it was estimated that APAC’s iGaming GGR was put at $28 billion, yet it’s only 41% of regulated share in the entire region.
APAC is also decisively mobile-first. IMARC estimates that mobile devices produced 68.2% of regional online gambling revenue in 2025, compared with 24.5% for desktop.
iGaming Statistics by Vertical
Crypto slowly and steadily gets into the iGaming environment, as by 2026 the gambling deposit volume in crypto totals over $44 billion with 84% year-over-year growth.
Sports betting
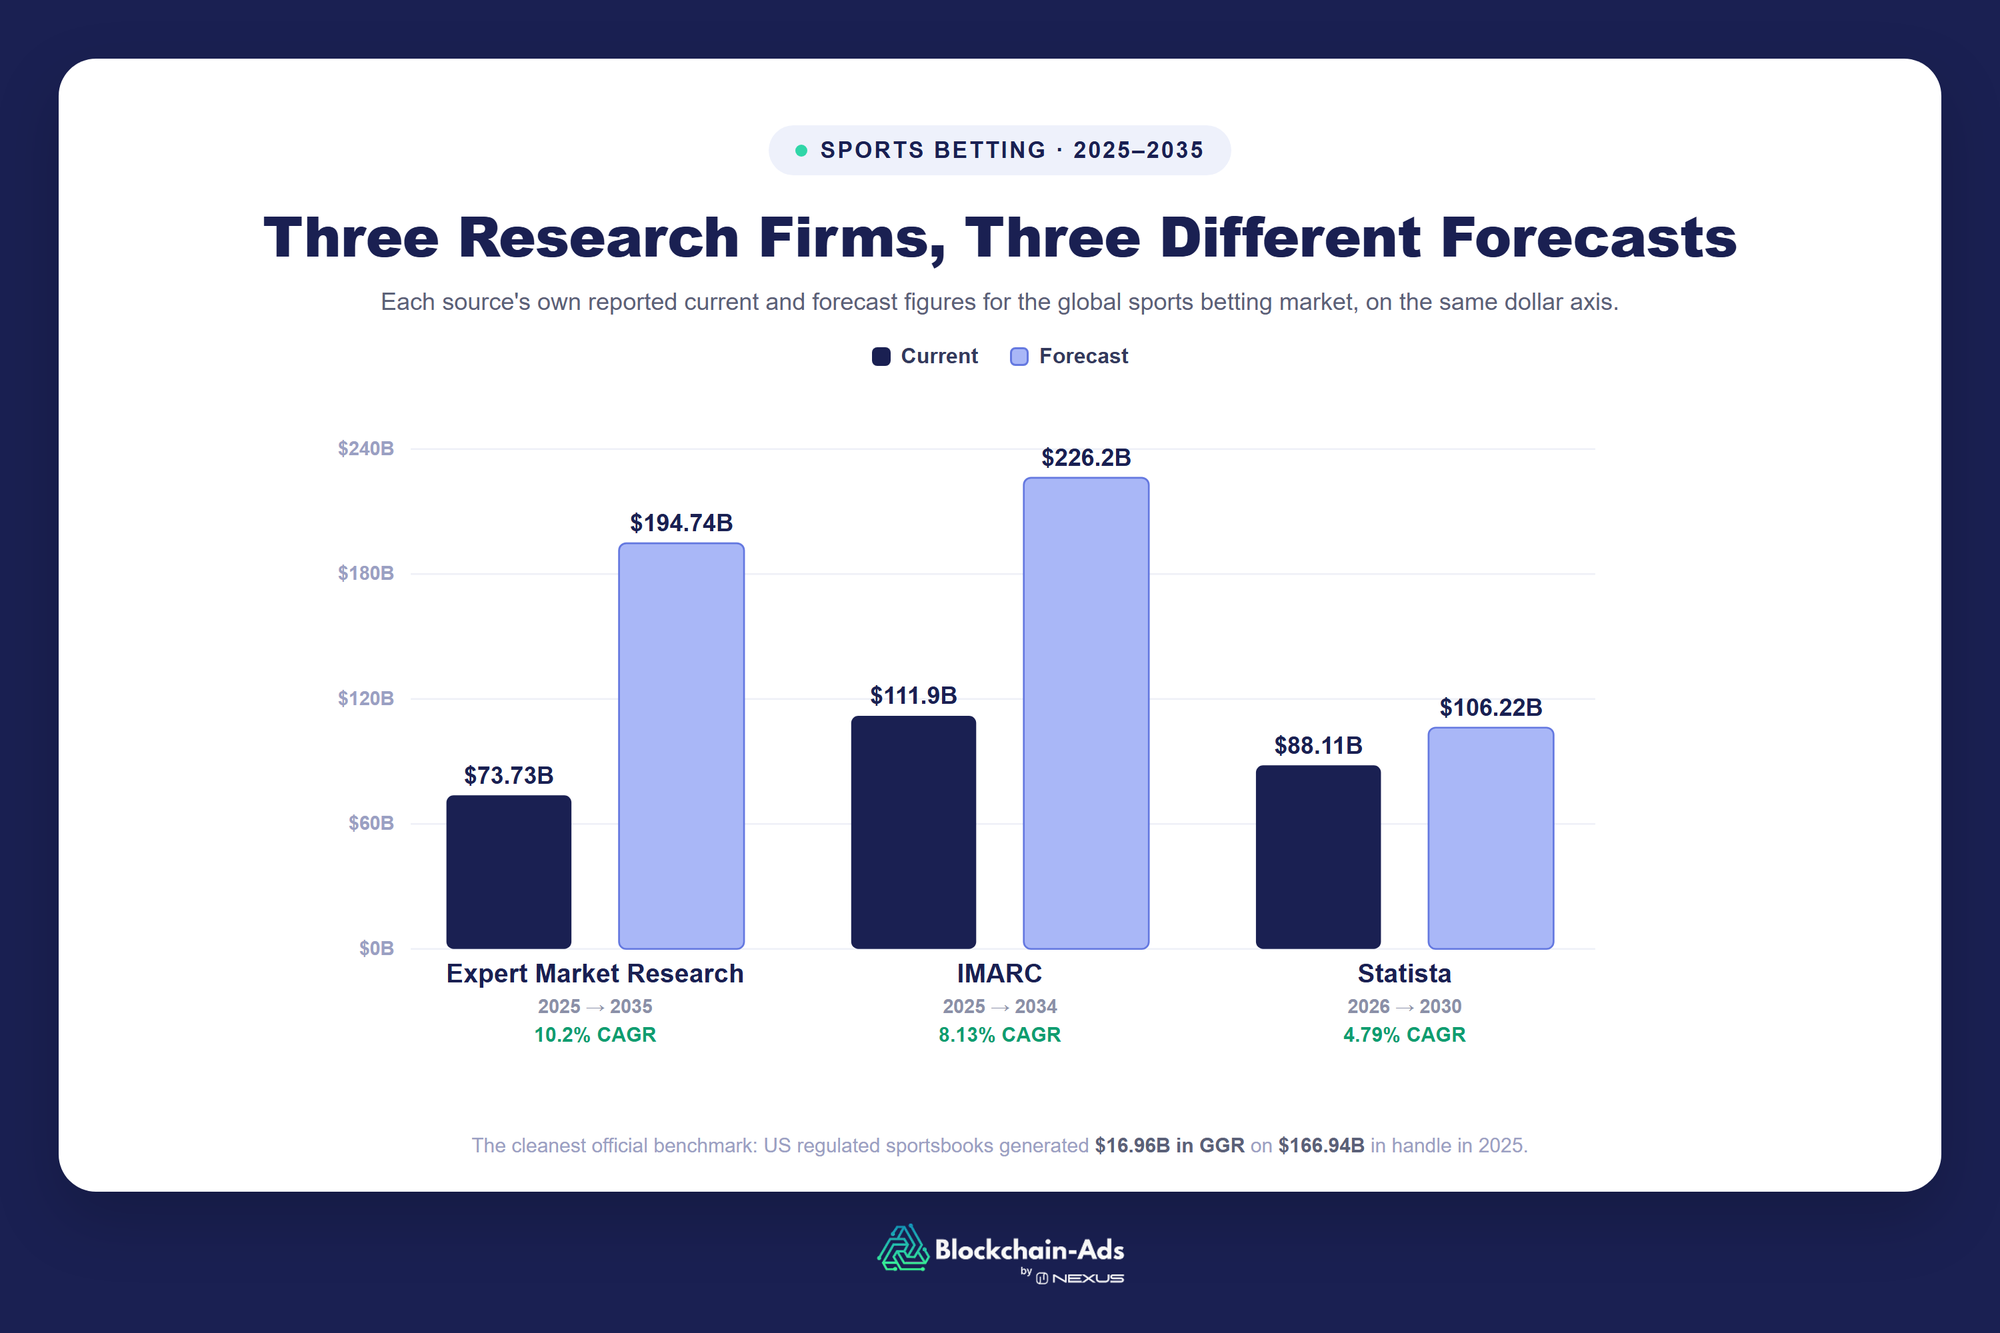
Sports betting is the largest revenue contributor in several broad online gambling estimates, as Expert Market Research puts online sports betting market size at $73.73 billion in 2025, forecasting $194.74 billion by 2035 at a 10.2% CAGR.
IMARC uses a broader sports betting definition and estimates $111.9 billion in 2025, reaching $226.2 billion by 2034 at an 8.13% CAGR. Statista projects the global sports betting market to reach $88.11 billion in revenue in 2026 and is expected to show an annual growth rate (CAGR 2026-2030) of 4.79%, resulting in a projected market volume of $106.22 billion by 2030.
The United States offers the cleanest official benchmark. The American Gaming Association reports that regulated commercial sportsbooks accepted $166.94 billion in handle and generated $16.96 billion in GGR in 2025. Esports is still a small component relative to the full sports betting market, but its size is growing.
Research and Markets estimates it will grow from $12.59 billion in 2025 to $14.17 billion in 2026 at a CAGR of 12.5% and to $21.6 billion by 2030 by 11.1% CAGR. Even by comparing multiple estimates, the esports betting market seems to be holding 10-20% of the entire sports betting industry.
Online casino
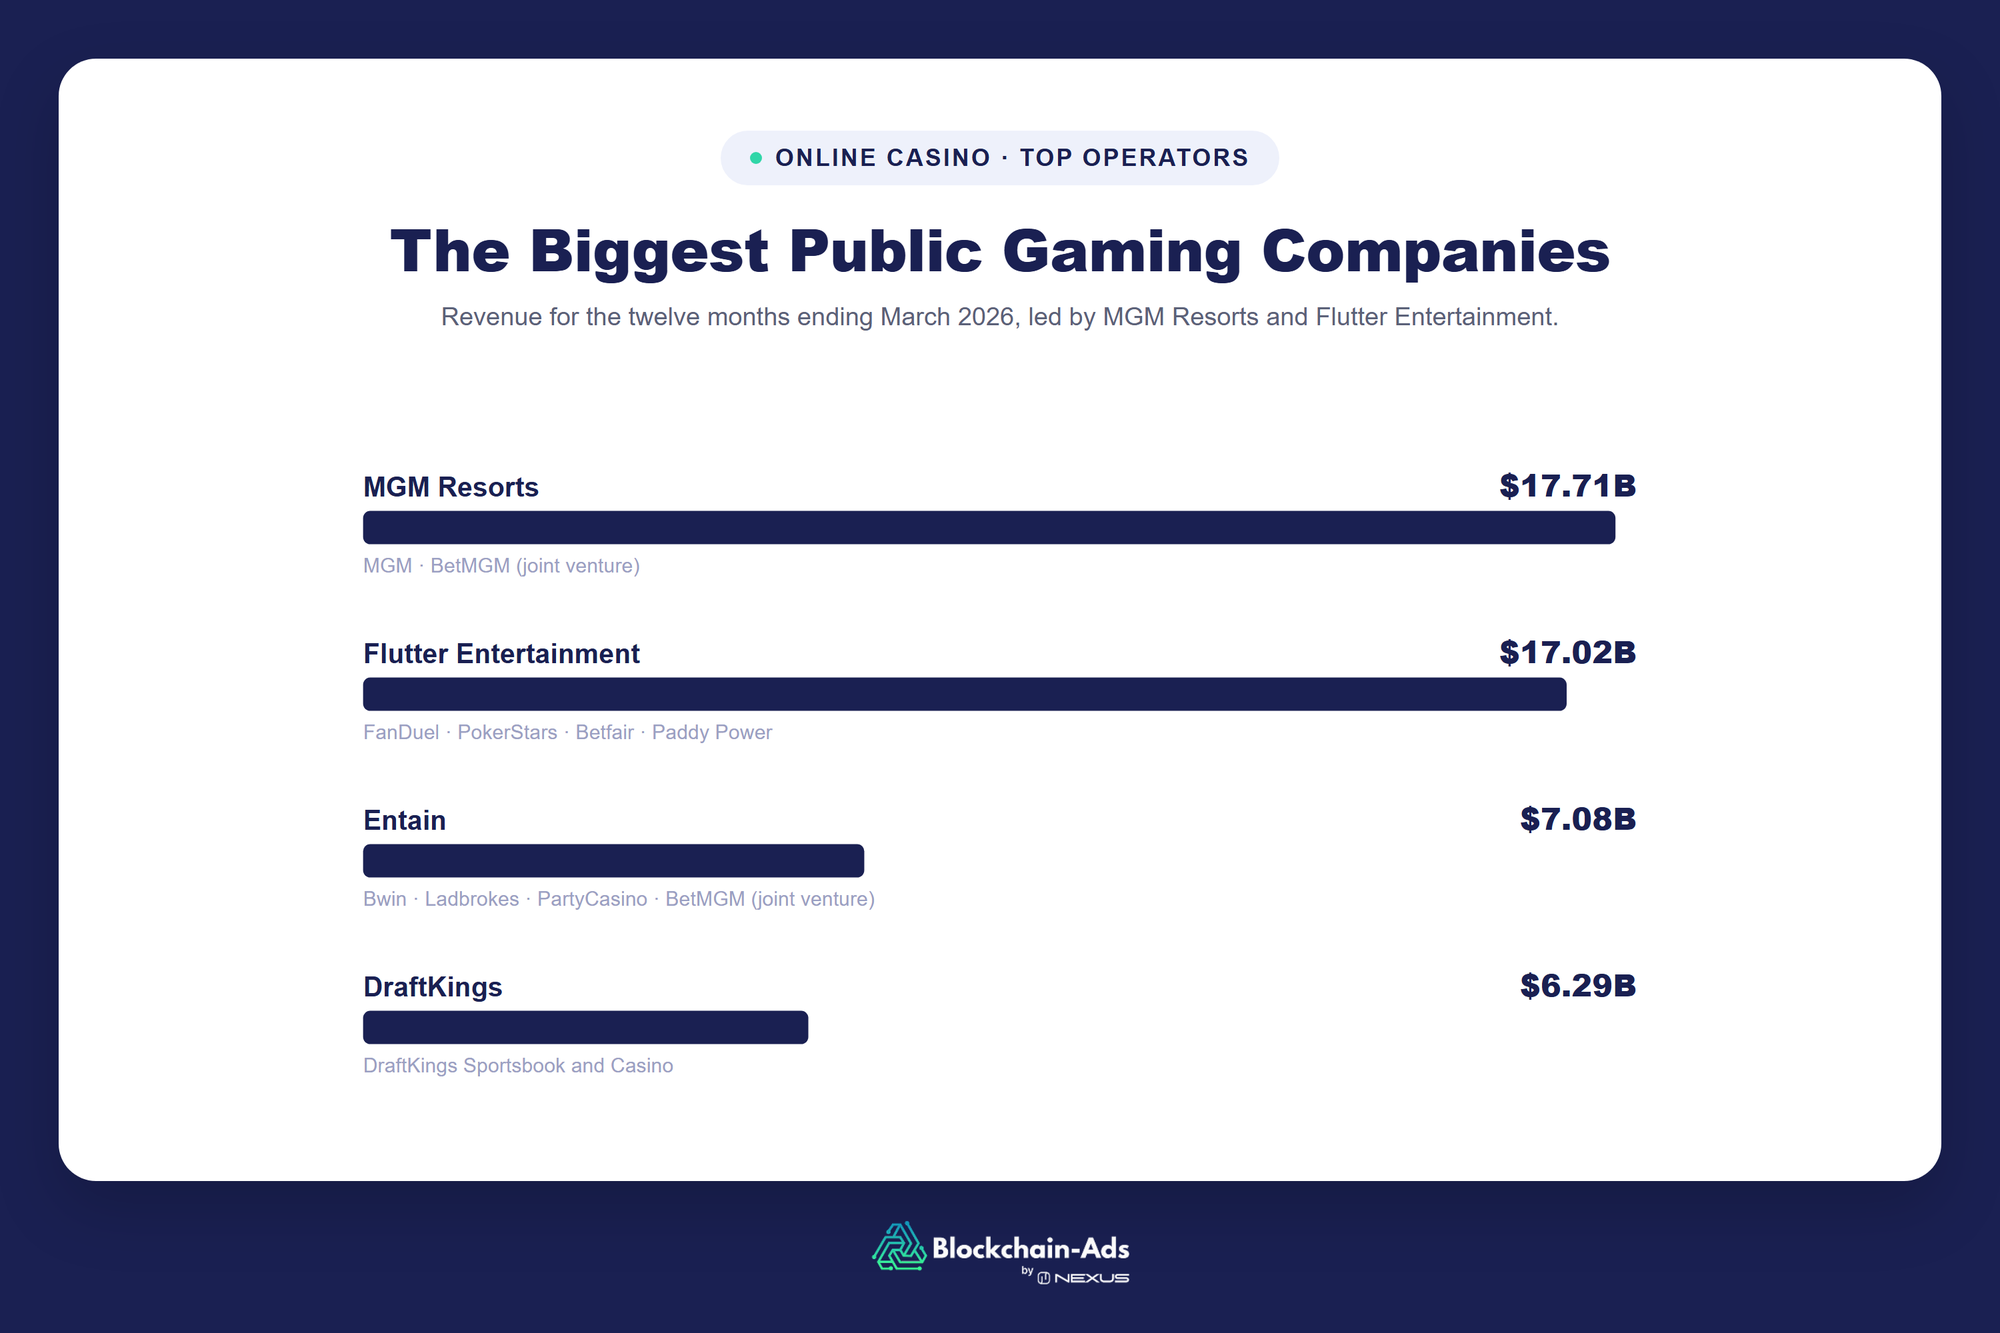
Online casinos make the highest value iGaming vertical in many regulated markets, as Grand View Research values the global segment at $19.1 billion in 2024, $23.9 billion in 2026, and $38.0 billion in 2030 at a 12.2% CAGR.
According to IMARC, the online casino market size took a 39% share of the entire industry in 2025 and was roughly at $39 billion. It’s estimated that there are about 3,700 online casinos operating globally in 95+ countries as of 2025.
CompaniesMarketCap lists the biggest of them by revenue:
The split between online casinos and sportsbooks is global, yet it is still on the side of the former in many regulated markets:
Crypto gambling
Estimates of the crypto gambling market vary wildly, from $5-11 billion to as high as $81 billion in 2024. But deposit volume hit $44 billion in 2026, up 84% year-over-year. TRM Labs tracked $51 billion in on-chain gambling volume in 2025 and $14 billion in Q1 2026 alone, up from just $2.6 billion in Q1 2021 (roughly 40% annual growth over five years).
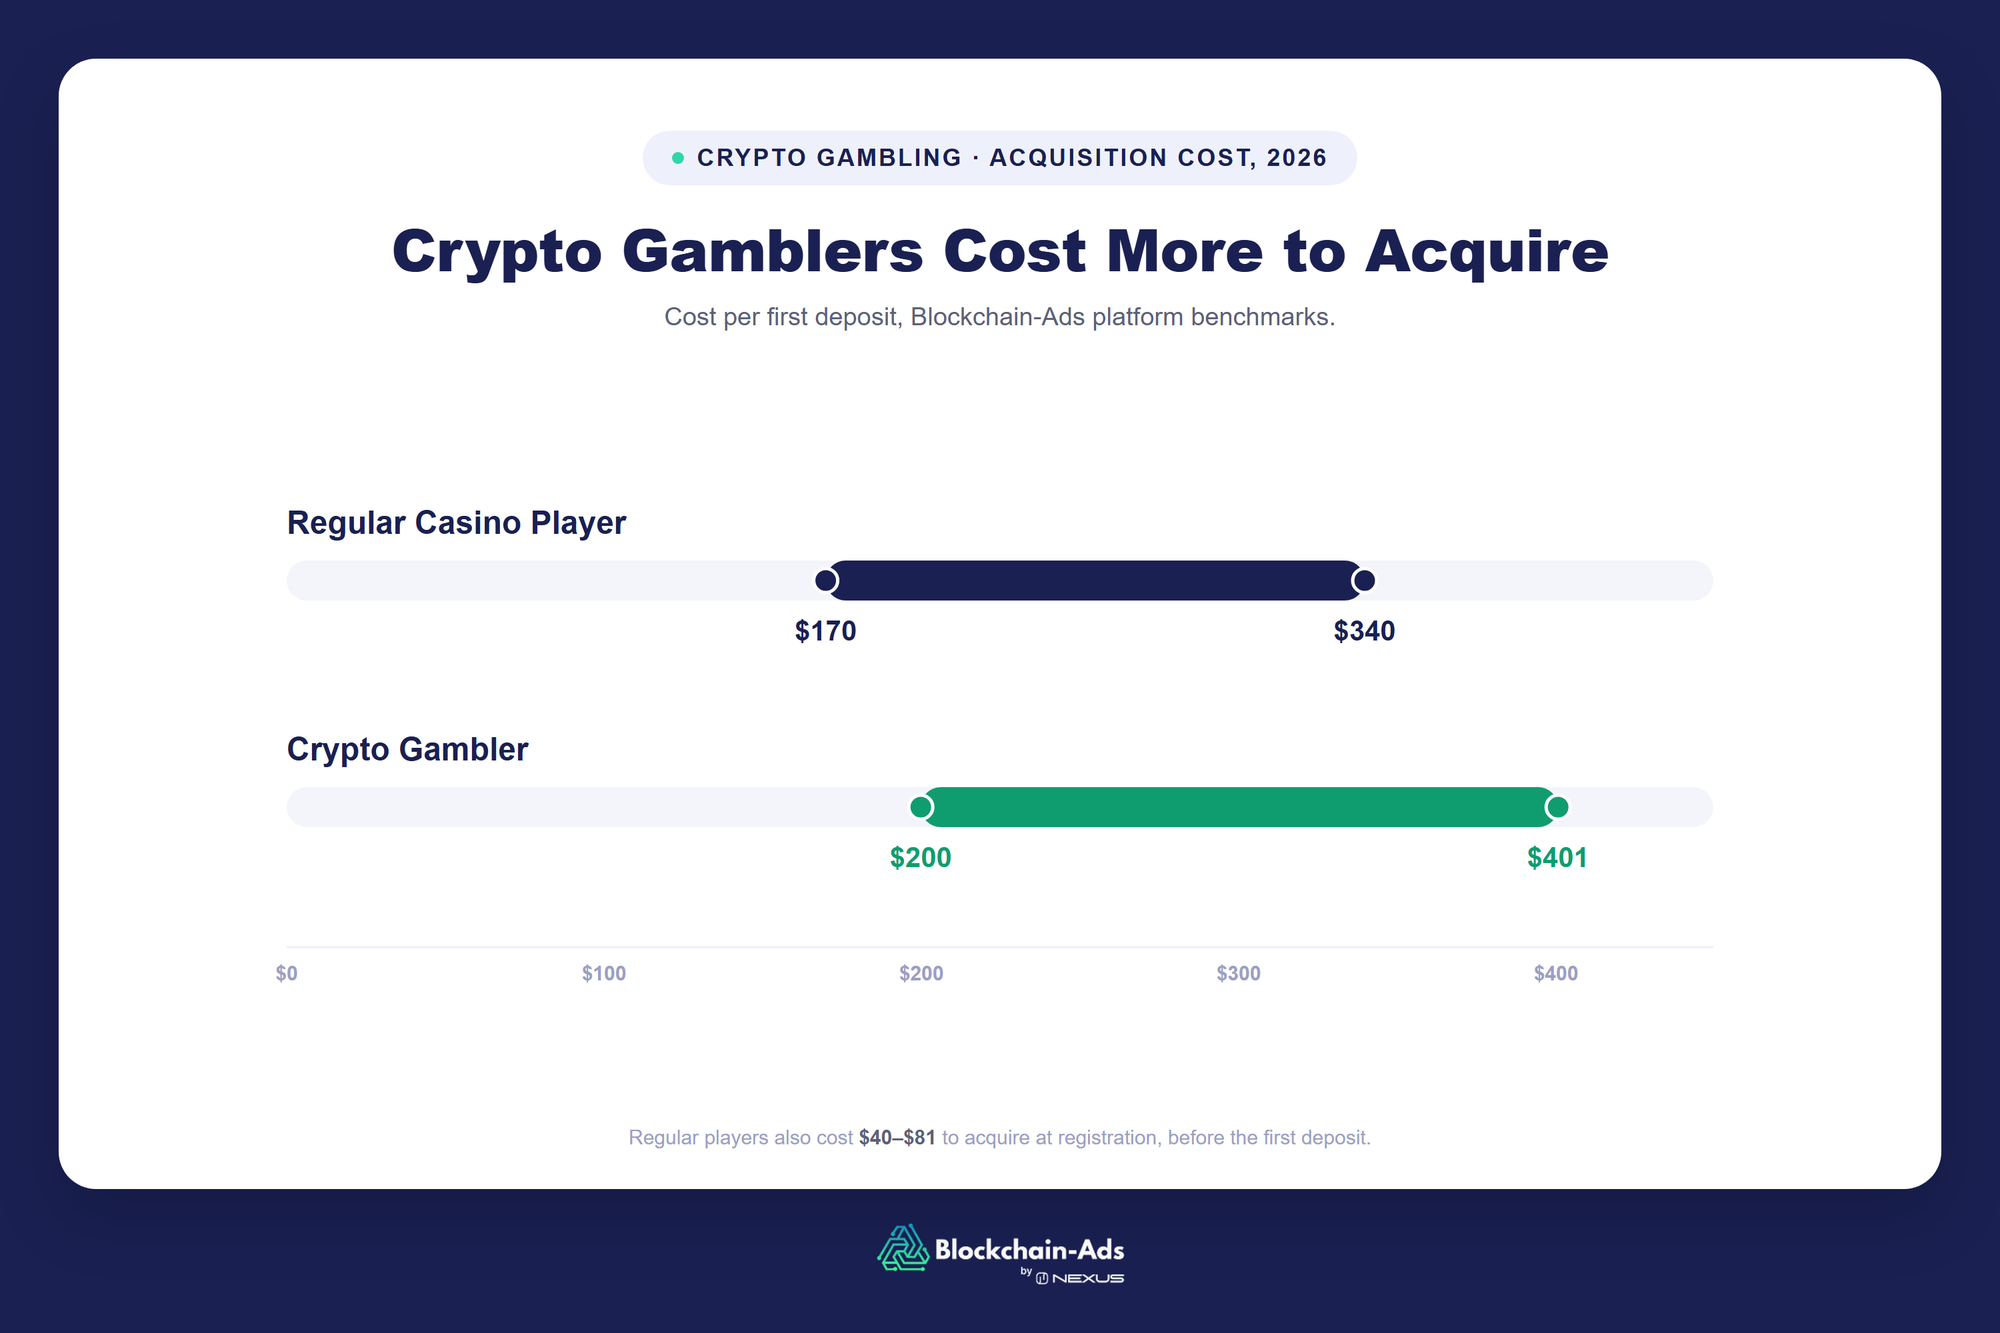
Crypto platforms make up an estimated 15-30% of the iGaming market overall, with crypto betting hitting 24.4% share in Q1 2024. That share shows up in acquisition costs too: a regular casino player costs $40-$81 per registration and $170-$340 per first deposit, while crypto gamblers cost more to acquire, $200-$401 per first deposit (Blockchain-Ads platform benchmarks, 2026).
Mobile gambling
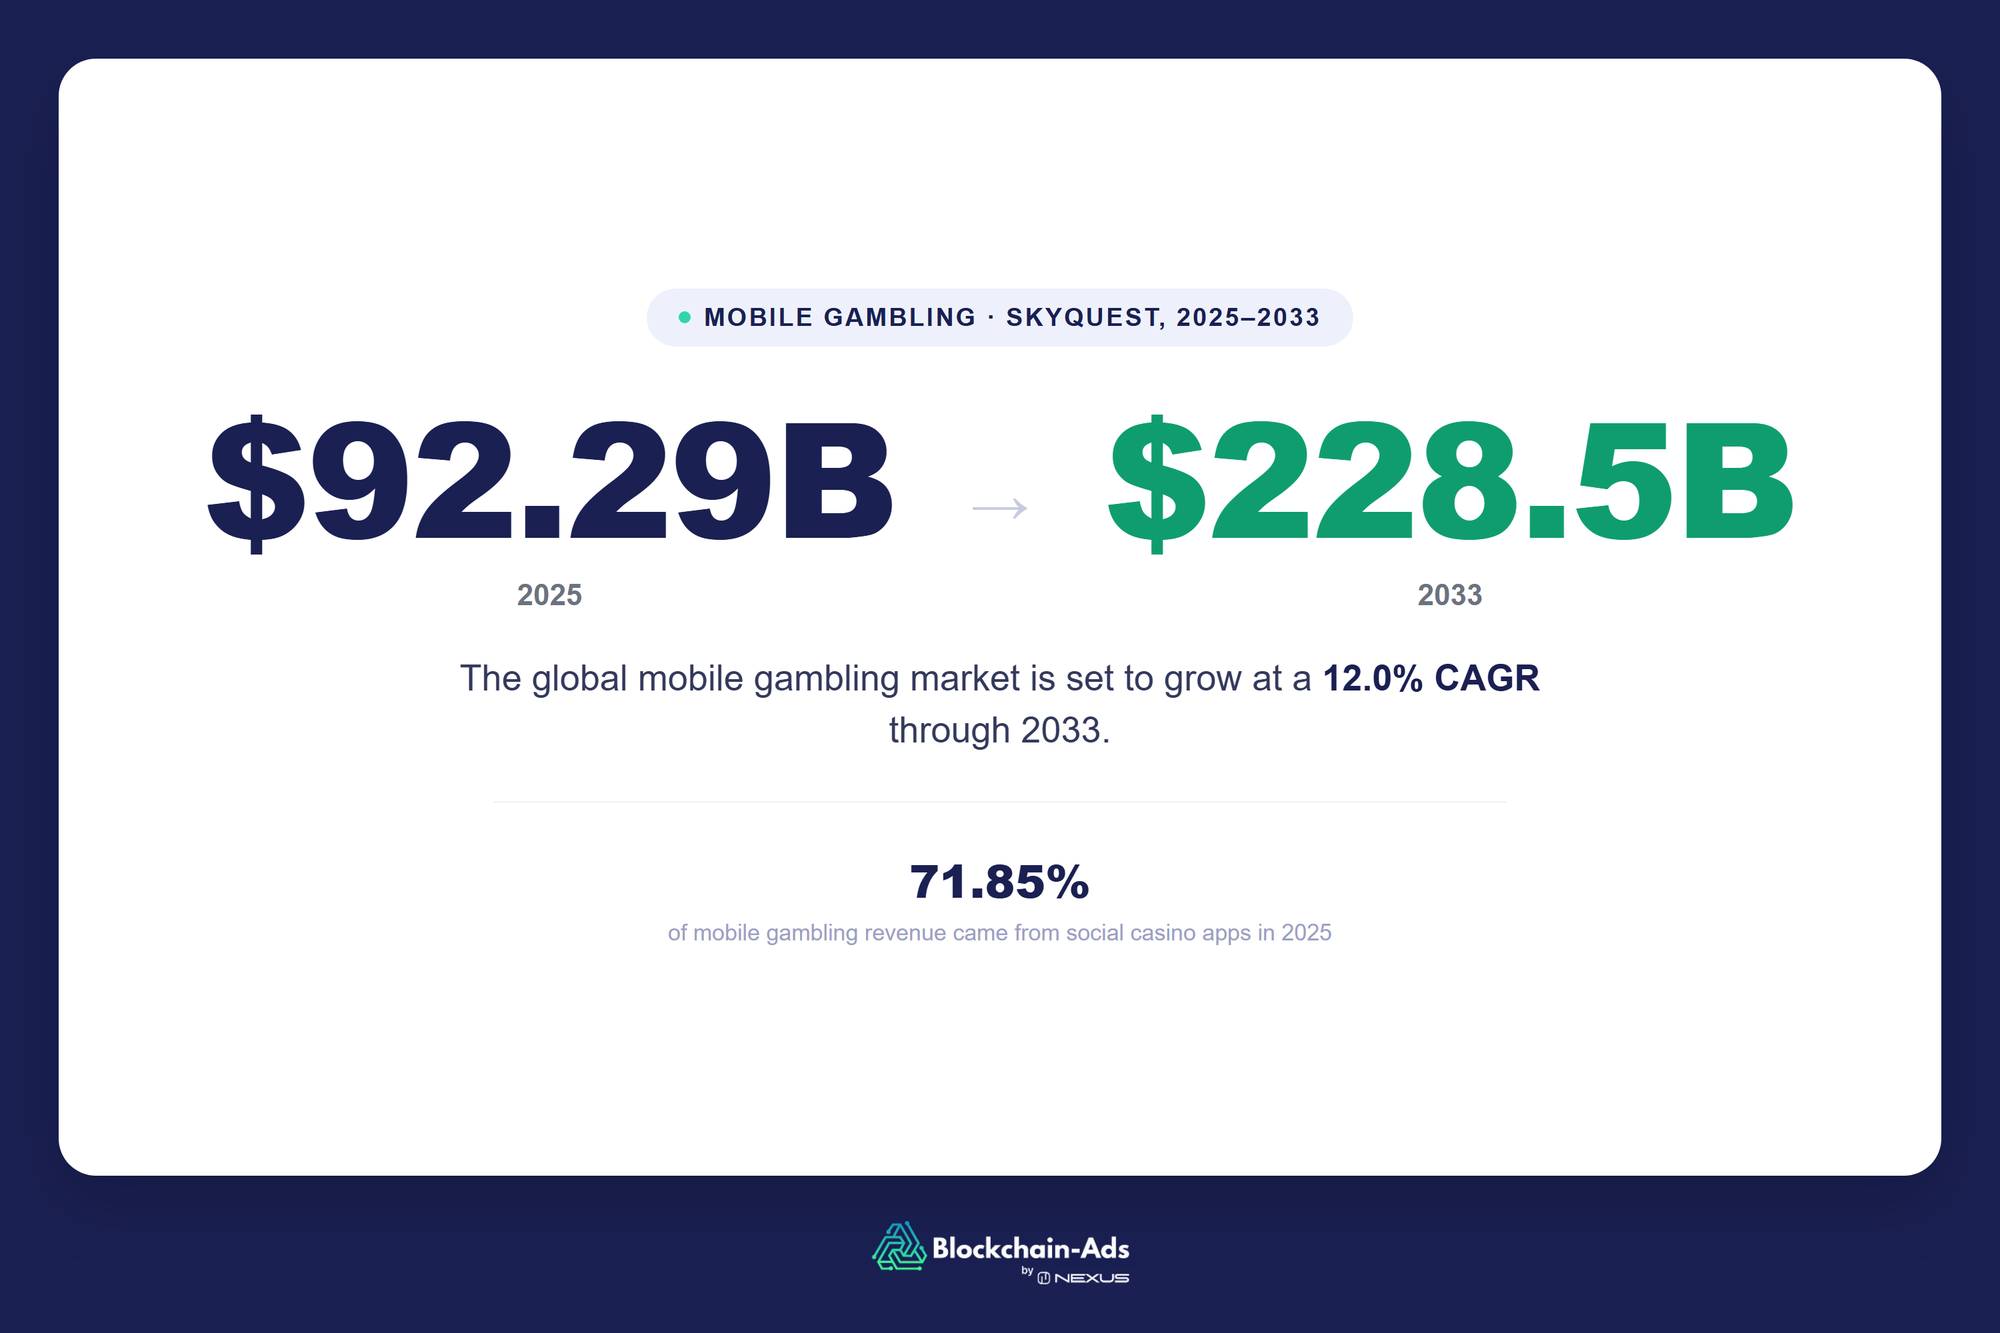
SkyQuest values the global mobile gambling market at $92.29 billion in 2025, growing to $228.5 billion by 2033 (12.0% CAGR). Mobile is just one slice of iGaming, but a large one; social casino apps alone made up 71.85% of that segment's revenue in 2025.
Mobile already dominates in Europe. EGBA reports phones and tablets generated 58% of European online gambling revenue in 2024, projected to hit 67% by 2029 as desktops' share drops from 42% to 33%. In the UK, the Gambling Commission found 50% of online gamblers used mobile in 2020, rising to 75% among 18-34-year-olds.
Australia offers a clearer picture: GambleAware NSW found 59.6% of sports bettors used a smartphone to place bets in 2019, compared to 36.4% at a physical venue and 23.5% on other devices; 64% had bet via mobile at some point, versus just 14% on desktop. Asia-Pacific leans mobile even harder; IMARC projects smartphones will drive 68.2% of the region's online gambling revenue in 2025, with desktop at only 24.5%.
Esports, lottery, and social casino

Esports betting is still smaller than sports betting overall, though the growth outlook remains sharper. Its market size is estimated at $12.59 billion in 2025, $14.17 billion in 2026 and $21.61 billion by 2030, at 11.1% CAGR through 2030. Market Research Future uses a wider forecast, from $14.76 billion in 2025 to $56.19 billion by 2035 at 14.3% CAGR.
Online lottery is another market with unexpected size, as Grand View Research estimates it to be $120.5 billion in 2024 and $127.2 billion in 2026, with draw games holding 50.4% of its 2024 market. IMARC estimates only $12.1 billion for 2025, while Expert Market Research puts it at $32.11 billion.
Social casino remains adjacent to real-money iGaming rather than a substitute for it. Mordor Intelligence estimates $9.06 billion in 2026 and $13.49 billion by 2031, at 8.32% CAGR. Slots represented 55.62% of social casino revenue in 2025, while the rest was combined across poker, bingo, sweepstakes, etc.
iGaming Advertising Statistics

Paid acquisition in iGaming is concentrated around affiliates, seasonal sports calendars, and the cost of reaching a player who actually deposits. The data is based on Blockchain-Ads 2026’s platform benchmark, a major DSP for advertising regulated industries:
- 74% of iGaming campaigns on the Blockchain-Ads network are run by affiliates.
- Advertisers increase spend by up to 82% before major sporting seasons.
- Casino player acquisition costs $40-$81 per registration and $170-$340 per first-time deposit.
- Crypto-casino FTDs cost $200-$401, compared with $170–$340 for classic iGaming.
- iGaming ad clicks cost $0.98-$1.96, while CPMs are between $4.38 and $8.75.
- High-Value Casino Players are the most expensive audience, reaching CPMs of up to $40 on the network.
The point of these benchmarks is not to make every operator chase the cheapest click. A lower CPA might still bring low-value players, while a higher FTD cost can make commercial sense where the geo, product, and retention strategy support it. More practical and compliance detail is available in the iGaming advertising guide.
iGaming Trends for 2026
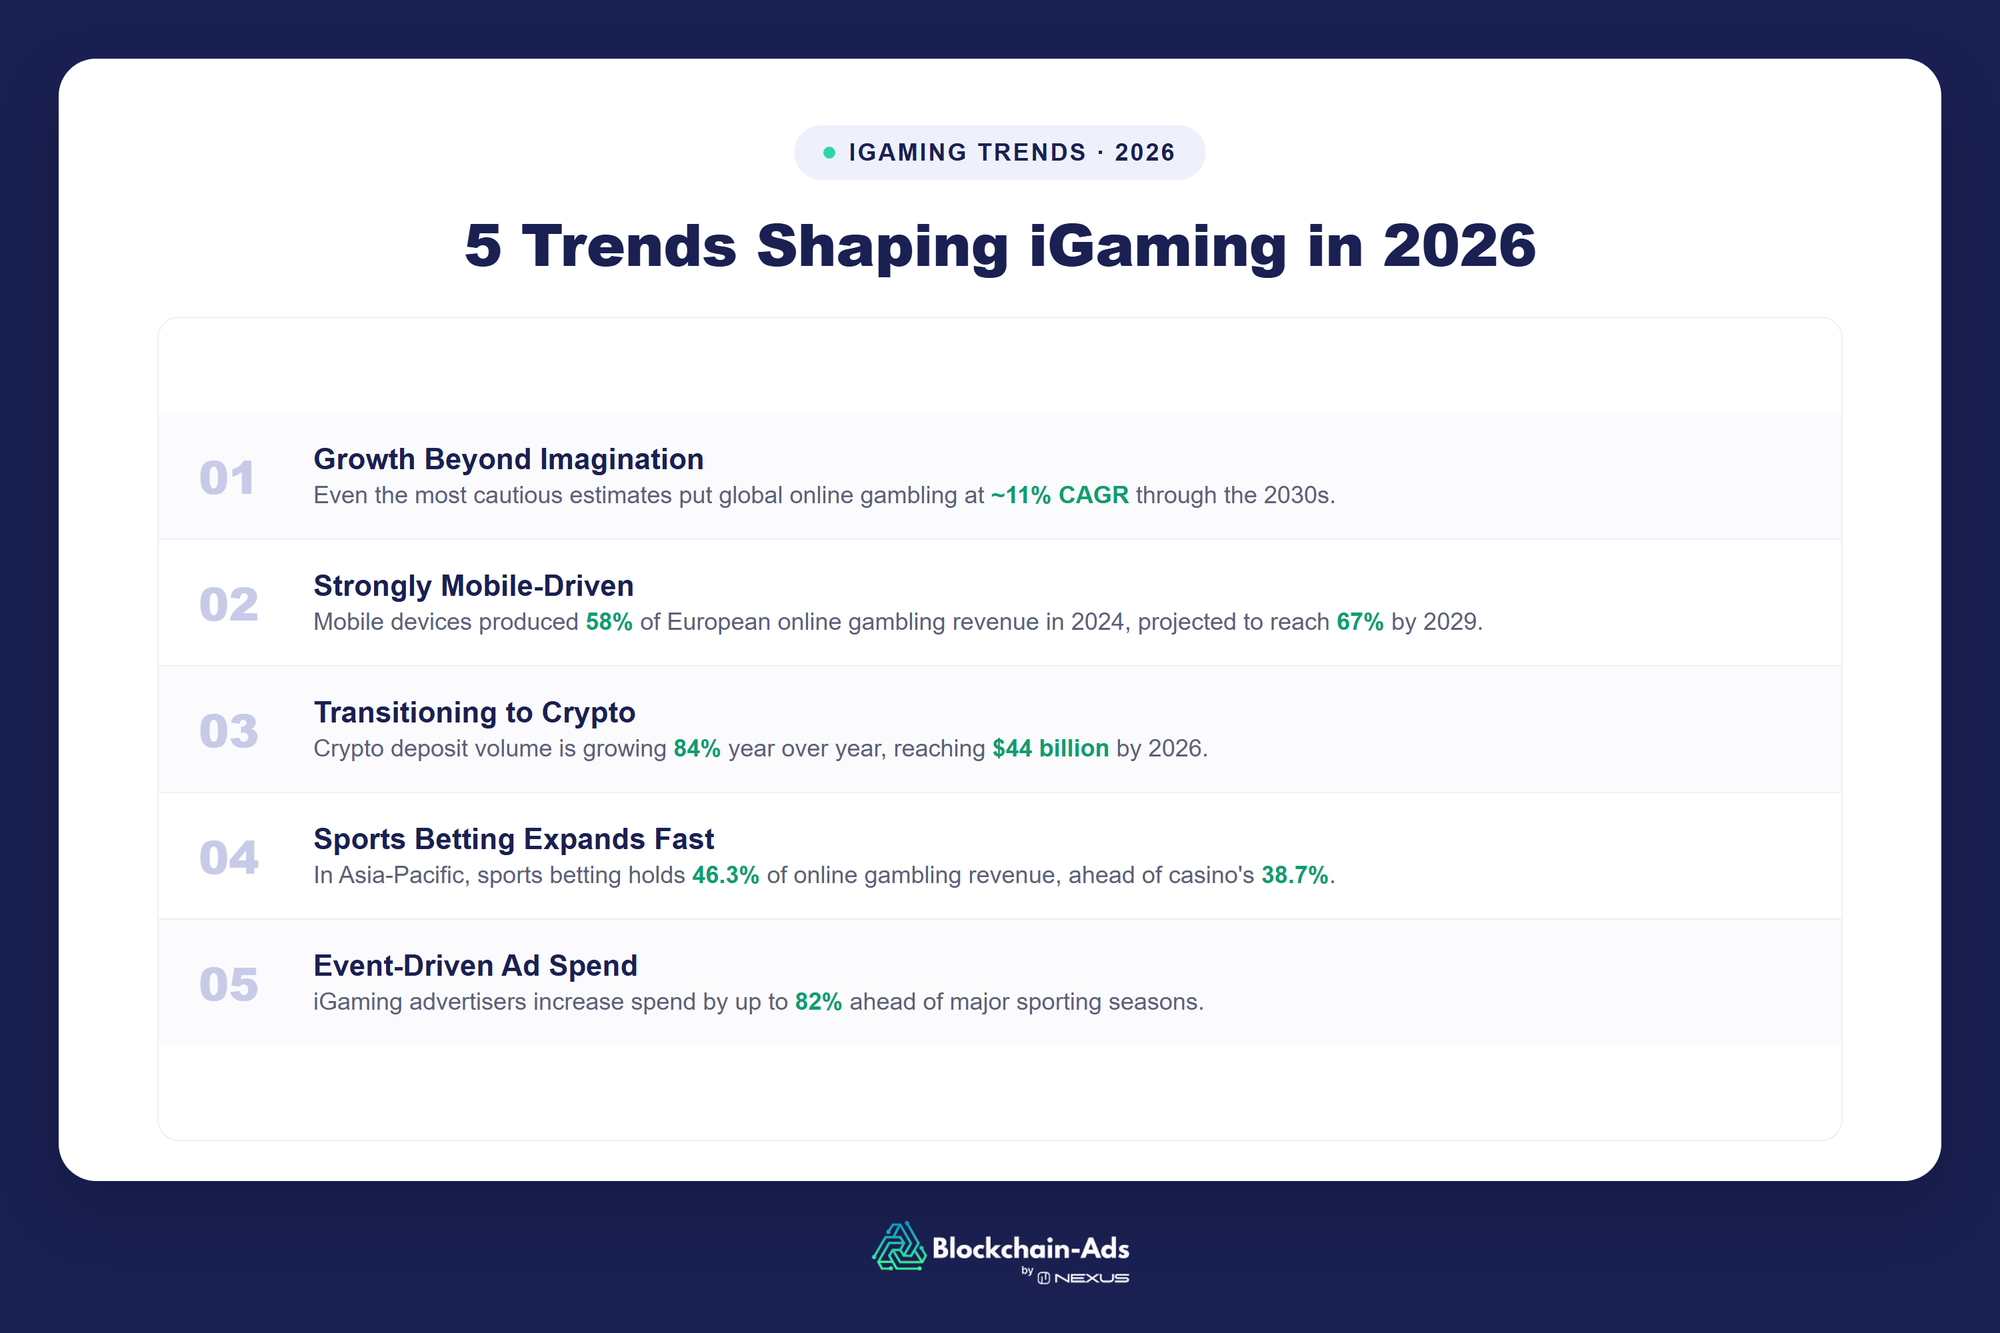
- Growth beyond imagination. The most humble estimates put global online gambling at ~11% CAGR through to the 2030s.
- Strongly mobile-driven. It’s estimated that mobile devices generated 58% of European online gambling revenue in 2024, with the share projected to reach 67% by 2029.
- Transitioning to crypto. The volume of crypto deposits to gambling grows 84% year-to-year, resulting in $44 billion by 2026.
- Sports betting expands in several fast-growing markets. In Asia-Pacific, IMARC estimates sports betting will hold 46.3% of total online gambling revenue in 2025, against 38.7% for casinos.
- Event orientation. Blockchain-Ads platform data shows iGaming advertisers increase ad spend by up to 82% ahead of major sporting seasons.
iGaming Statistics FAQ
How big is the iGaming market in 2026?
Grand View Research estimates the global online-gambling market at $97.7 billion in 2026. The figure is lower than broader gambling market forecasts because the report measures online gambling rather than all gambling activity.
What is the CAGR of the online gambling market?
Grand View Research forecasts an 11% CAGR from 2026 to 2033. Other reports use different scopes, so IMARC forecasts 6.8% through 2034, and Expert Market Research forecasts 11.4% through 2035.
How fast is the sports betting market growing?
Statista forecasts global sports betting revenue to grow at a 4.79% CAGR from 2026 to 2030. EMR and IMARC project the annual compound growth rate at 10.2% and 8.13%, respectively.
Which US states allow iGaming?
Seven US states had legal commercial iGaming in 2025: Connecticut, Delaware, Michigan, New Jersey, Pennsylvania, Rhode Island, and West Virginia, according to the AGA’s State of the States 2026 report.
Who has the largest iGaming market share?
At a regional level, Europe accounted for 41% of global online gambling revenue in 2025.
What is the fastest-growing iGaming vertical?
Mobile gambling is forecast to grow at a 12.0% CAGR from 2026 to 2033, while esports betting is forecast at an 11.1% CAGR through 2030.
How big is the crypto gambling market?
TRM Labs recorded $51 billion in on-chain gambling volume in 2025, while other sources report up to $44 billion in 2026.
What percentage of online gambling is mobile?
Mobile devices generated 58% of European online-gambling revenue in 2024, according to EGBA. The share varies by market and product: IMARC estimates 68.2% of APAC online-gambling revenue came from mobile in 2025.
Sources and Methodology
This article keeps GGR, revenue, handle, deposits, and on-chain transfer volume separate. Market research figures were put piece-by-piece and are attributed to these resources:
- American Gaming Association: aggregates reported results from regulated US commercial operators and state regulators.
- EGBA: market report, combining its model with regional operator and market data.
- Grand View Research: proprietary market-research model using historical data, primary research, and forecast assumptions.
- Statista: modelled revenue forecast.
- IMARC: proprietary complex market sizing and forecast model.
- Expert Market Research: alternative market models used to show scope differences, commercial forecasts based on its own historical dataset, analyst research, and assumptions.
- Market Research Future: commercial esports betting forecast with its own market definition, base year, and long-range projection.
- Market Reports World: commercial market report estimate used for its reported operator count and online/land-based split.
- Research and Markets: distributor summary of a third-party commercial market forecast.
- TRM Labs, CompaniesMarketCaP, SkyQuest, Casino Reports, SportBot AI, Stock Analysis: mixed analytics with proprietary data, public-company financial aggregation, commercial forecasts, and editorial market share tracking.
- GeoComply, Business of iGaming, Gambling Insider, Gaming Intelligence, MCMC/Bernama, SOFTSWISS, PAGCOR, The Sun, Berjaya, National Thailand, Portal Komdigi: a mixed evidence group of platform telemetry, blockchain tracking, operator disclosures, regulatory releases, and specialist reporting.
- UK Gambling Commission, NJ Division of Gaming Enforcement, GambleAware NSW, Malta Gambling Authority, National Betting Authority, Tax and Customs Board, Lottery and Gambling Supervisory Inspection, National Gambling Control Commission: data from government authorities on device and channel-use evidence, official regulator reports, tax records, and population surveys.
- Mordor Intelligence: proprietary social-casino market estimate and forecast.
- Blockchain-Ads iGaming platform: actual affiliate advertising data for iGaming in 2026, based on campaign-level benchmarks.