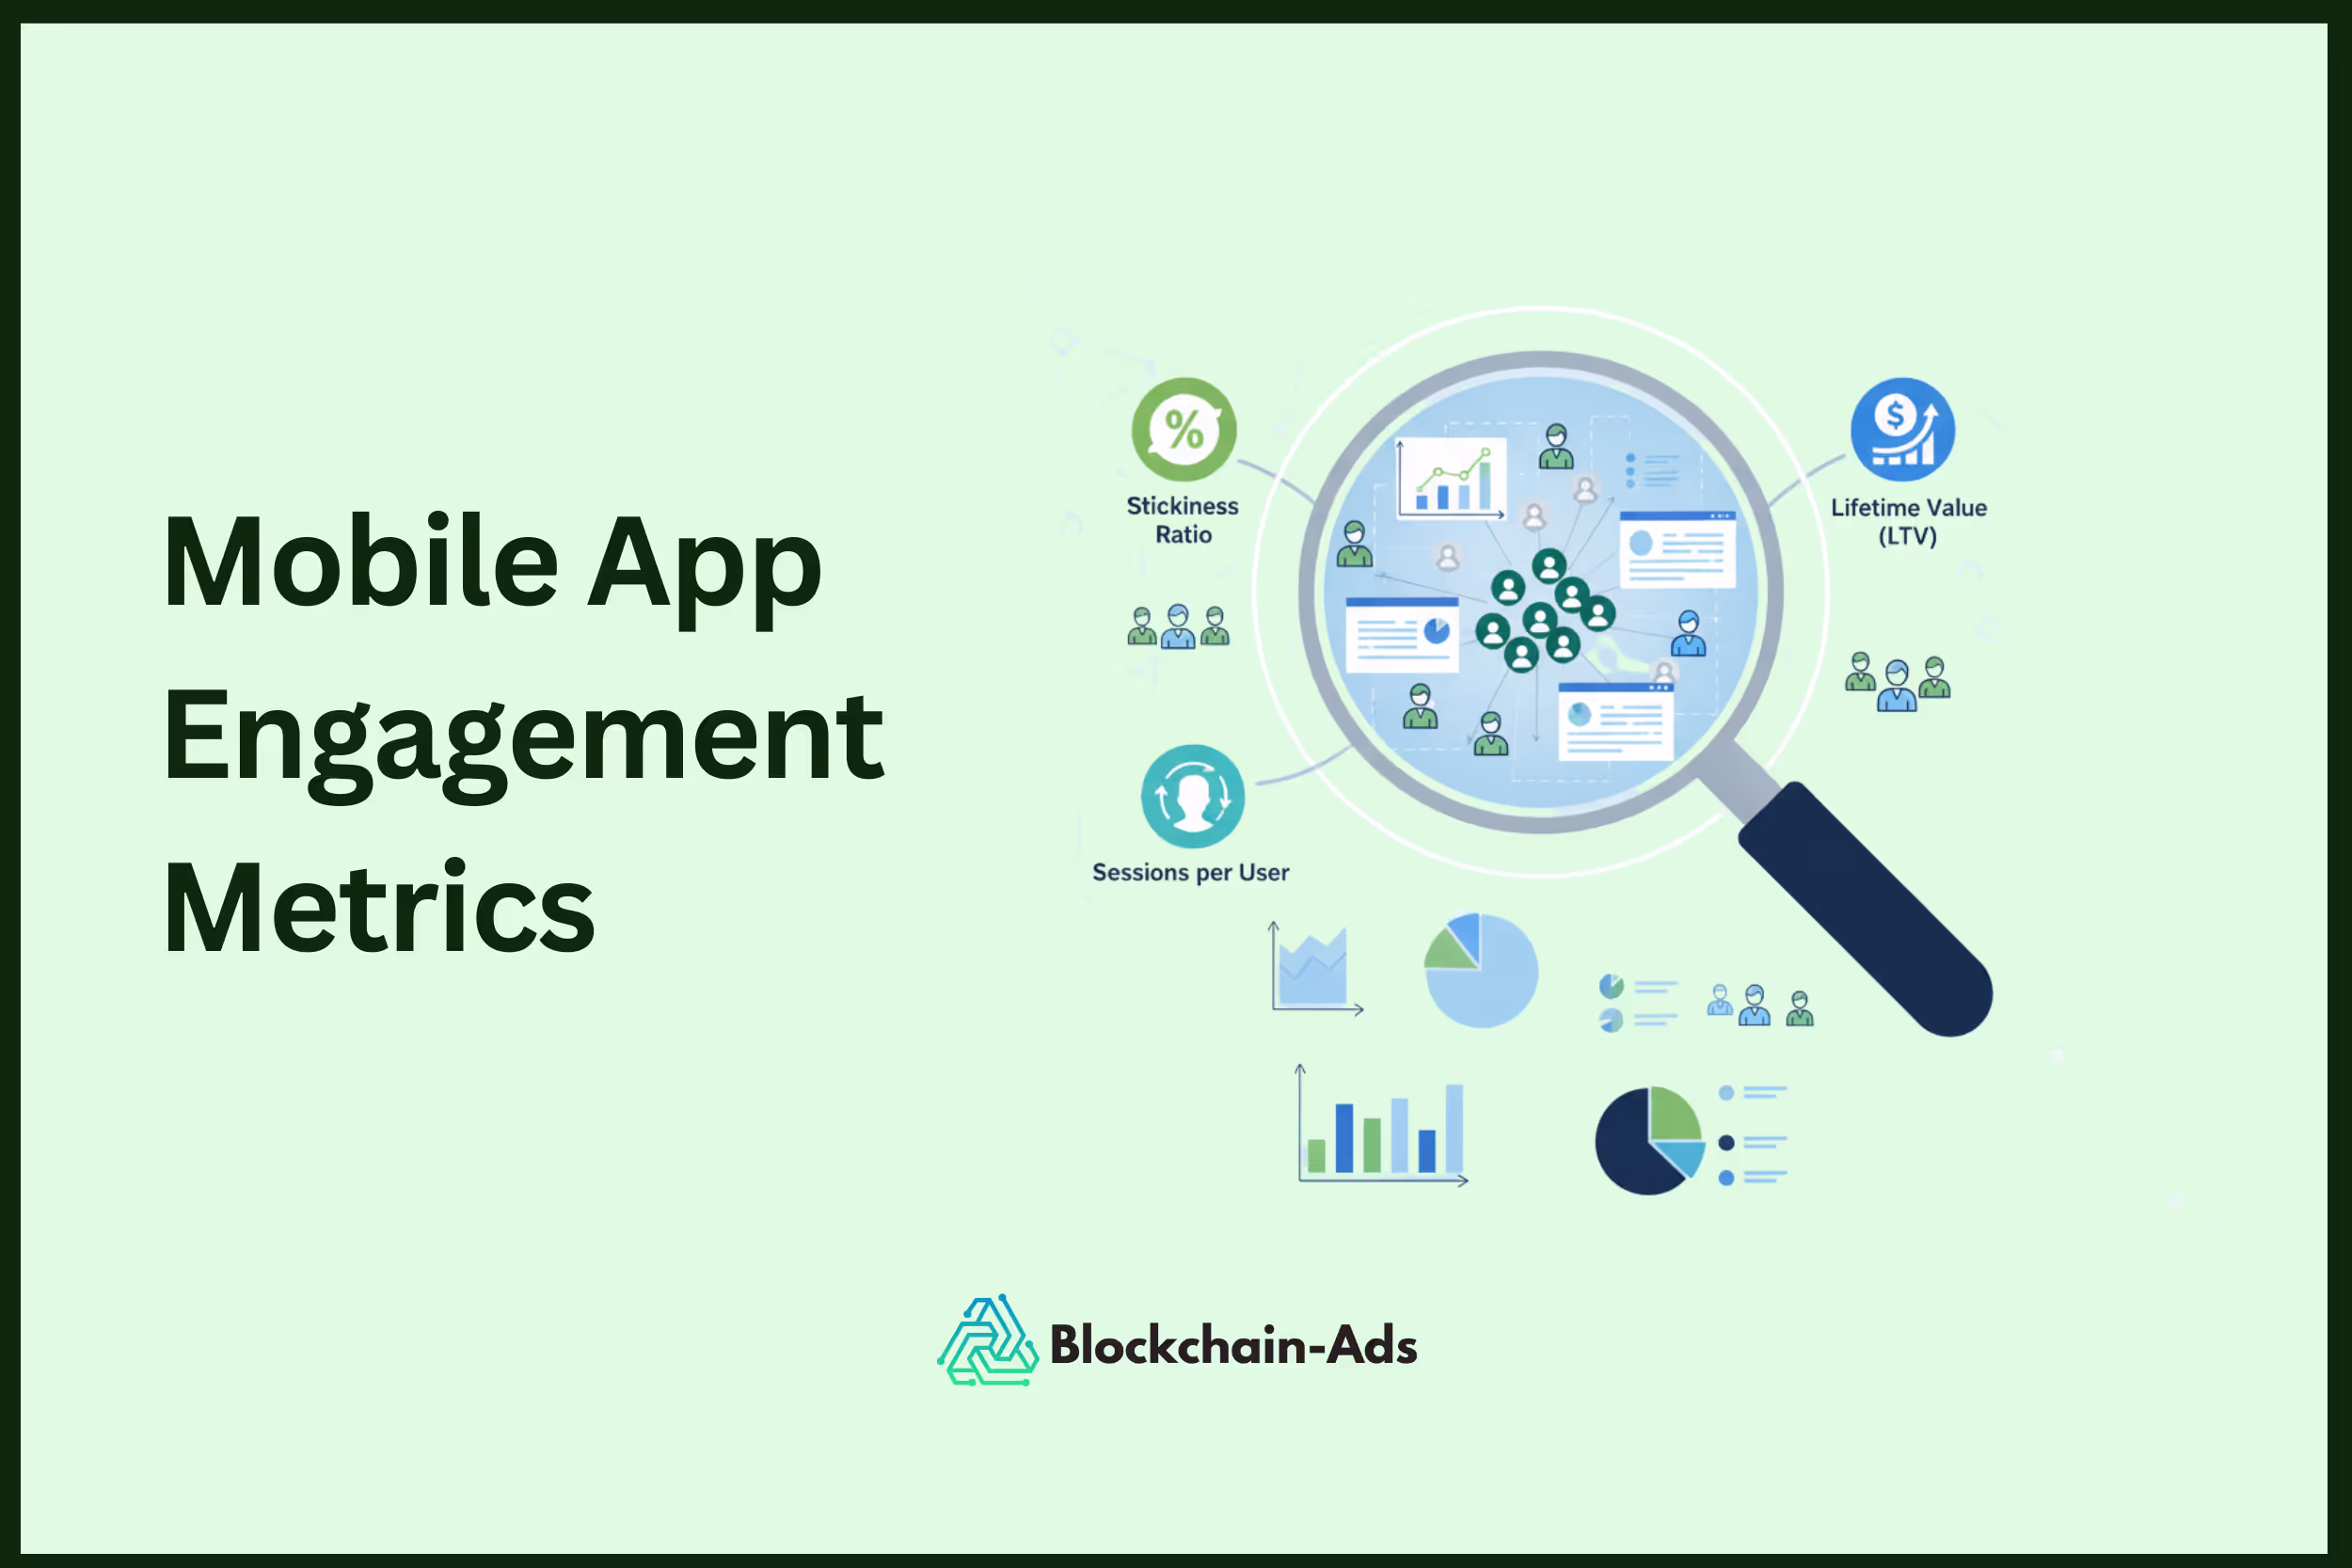
11 Métricas de Engagement de Apps Móviles para Analizar
Después de lanzar una nueva app y lograr que las personas la descarguen, el siguiente paso es mantener a los usuarios comprometidos a lo largo del tiempo. Ahí es donde las cosas se vuelven difíciles tanto para los equipos de desarrollo como para los marketers. Debes saber cómo se sienten los usuarios sobre tu app, qué los hace dejar de usarla y qué los mantiene leales.
Rastrear los datos de engagement dentro de la app es la principal forma de obtener esta información vital. Hemos reunido 11 de las métricas de engagement de apps móviles más importantes que deberías analizar como empresa, desarrollador o especialista en marketing de aplicaciones móviles.
¿Qué son las métricas de engagement de apps móviles?
Las métricas de engagement de apps móviles son números que muestran cómo las personas usan tu aplicación. Estas métricas revelan qué hacen los usuarios, con qué frecuencia regresan y cuánto tiempo pasan dentro de la app.
Al rastrear estos números, puedes identificar patrones en el comportamiento del usuario, encontrar dónde las personas pierden interés y ver qué los hace volver. Los equipos utilizan esta información para mejorar funciones, guiar el marketing y planificar las próximas actualizaciones.
11 Métricas Críticas de Engagement de Apps Móviles para Medir
Saber en qué métricas enfocarse marca toda la diferencia. A continuación se presentan 11 métricas clave de engagement de usuarios de apps móviles que todo equipo debería rastrear. Cada una te brinda un ángulo diferente sobre cómo los usuarios interactúan con tu aplicación y qué impulsa el crecimiento. Sin más preámbulos, revisemos cada una:
1. Tasa de Retención (Día 1, 7, 30)
La tasa de retención mide la proporción de usuarios que regresan a tu app después de instalarla. Este número te ayuda a ver si las personas encuentran valor real y quieren seguir usando tu producto. Una alta retención significa que los usuarios se quedan contigo, mientras que tasas bajas sugieren problemas en la incorporación, las funciones o la satisfacción.
%252520definition.png)
Los equipos generalmente verifican la retención en el Día 1, Día 7 y Día 30 usando esta fórmula simple:
Tasa de retención = (Usuarios activos durante el período) ÷ (Número de instalaciones al inicio del período)
Por ejemplo, si tienes 4,000 instalaciones y 800 usuarios aún activos después de una semana, tu tasa de retención para el Día 7 es del 20%.
2. Usuarios Activos (DAU y MAU)
Alguien descargó tu app la semana pasada; ¿y ahora qué? Los usuarios activos muestran cuántas personas abren e interactúan con tu app cada día o mes. Los usuarios activos diarios (DAU) cuentan cada persona una vez por día, sin importar cuántas veces usen la app. Los usuarios activos mensuales (MAU) rastrean inicios de sesión únicos durante un mes, brindándote una imagen más amplia del engagement regular.
Herramientas populares como Google Analytics y Mixpanel facilitan el seguimiento de tu DAU y MAU. Algunas plataformas incluso te permiten ver cuántos usuarios están activos en ciertas funciones, como chat o mensajería.
3. Ratio DAU/MAU (Adherencia)
El ratio DAU/MAU, a menudo llamado adherencia, compara tus usuarios activos diarios con tus usuarios activos mensuales. Este número te dice con qué frecuencia las personas regresan a tu app dentro de un mes. Un ratio más alto significa que los usuarios forman un hábito y siguen regresando, no solo visitando de vez en cuando.
Para encontrar tu adherencia, divide DAU entre MAU, luego multiplica por 100 para obtener un porcentaje. Por ejemplo, si tienes 2,000 usuarios activos diarios y 10,000 usuarios activos mensuales, tu tasa de adherencia es del 20%. Esta métrica te ayuda a ver si tu app es parte de las rutinas de las personas o si simplemente entran de vez en cuando.
4. Sesiones por Usuario
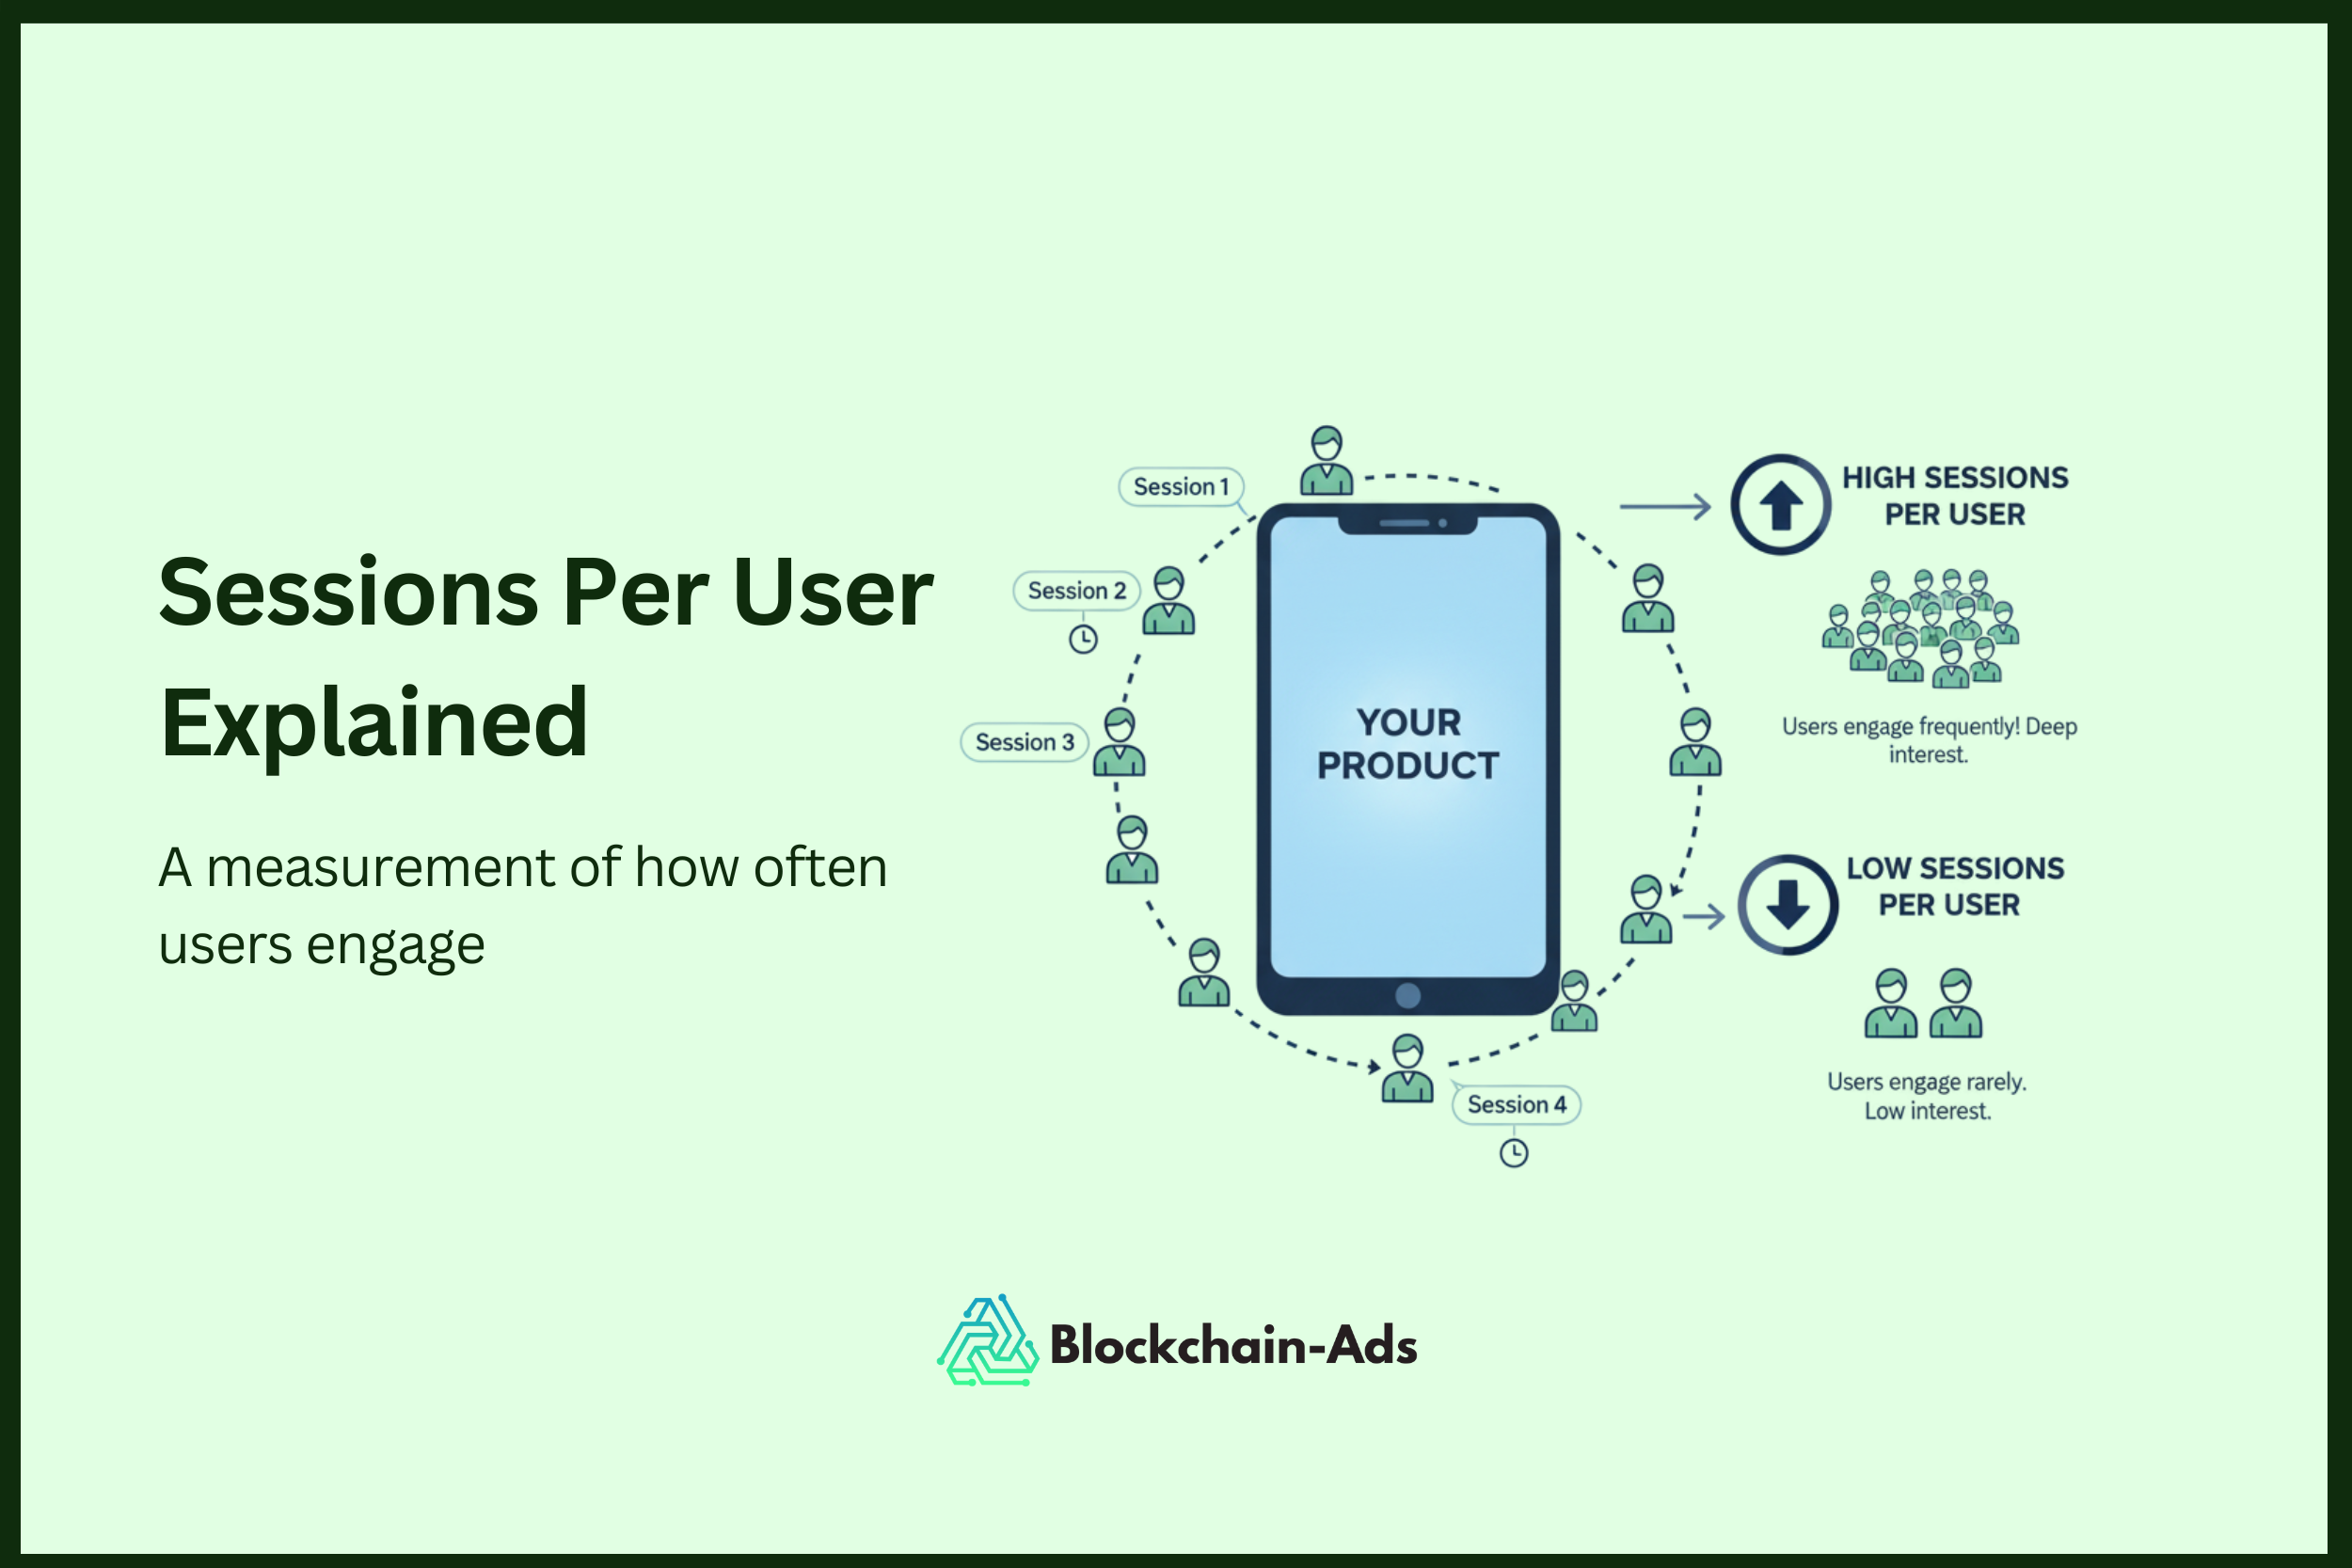
Otro KPI que deberías rastrear son las sesiones por usuario, que te dice cuántas veces, en promedio, cada persona abre tu app durante un período determinado. Esta métrica destaca con qué frecuencia los usuarios sienten la necesidad de regresar o interactuar con las funciones de tu app. Más sesiones por usuario generalmente significan que tu app ofrece algo que mantiene a las personas comprometidas y regresando.
Puedes rastrear este número diariamente, semanalmente o mensualmente. Por ejemplo, si tienes 2,000 sesiones en una semana y 500 usuarios, tu promedio es de cuatro sesiones por usuario. Observar esta tendencia te ayuda a detectar cambios en el engagement y reaccionar rápidamente si los números bajan.
5. Duración Promedio de Sesión
Algunos usuarios simplemente abren una app y se van sin usarla. La duración promedio de sesión muestra cuánto tiempo permanece un usuario en tu app durante cada visita. Obtienes esto midiendo el tiempo desde que alguien abre la app hasta que la cierra o deja de realizar acciones. Una sesión más larga significa que los usuarios encuentran suficiente valor para quedarse y explorar.
Si la mayoría de las sesiones son cortas, es posible que las personas no vean mucha razón para quedarse o interactuar. Para aumentar la duración de la sesión, agrega contenido fresco, simplifica la navegación o introduce funciones sociales que animen a los usuarios a pasar más tiempo dentro.
6. Tasa de Uso de Funciones
La tasa de uso de funciones rastrea con qué frecuencia los usuarios interactúan con partes específicas de tu app. Esta métrica muestra qué funciones atraen atención y cuáles las personas tienden a ignorar. Los equipos usan estos datos para identificar las herramientas más valiosas, eliminar peso muerto o decidir qué necesita mejorarse.
Mides el uso de funciones dividiendo el número de usuarios únicos para una función entre tus usuarios activos totales, luego multiplicando por 100 para obtener un porcentaje. Por ejemplo, si 400 de 1,000 usuarios activos prueban el chat dentro de la app, la tasa de uso de la función es del 40%. Rastrear esto a lo largo del tiempo revela cambios en las necesidades de los usuarios y guía las decisiones del producto.
7. Vistas de Pantalla por Sesión
Las vistas de pantalla por sesión te dicen cuántas pantallas diferentes visita un usuario cada vez que abre tu app. Esta métrica te ayuda a comprender cómo los usuarios navegan por tu app y si exploran más allá de la pantalla de inicio.
Si las personas ven muchas pantallas, tu app probablemente fomenta la exploración o tiene contenido que capta el interés. Los números bajos pueden indicar fricción, diseños confusos o falta de funciones atractivas. Para encontrar esta métrica, divide el número total de vistas de pantalla entre el total de sesiones en un período determinado.
Rastrear las vistas de pantalla por sesión te ayuda a identificar tendencias, corregir cuellos de botella y diseñar recorridos más fluidos que mantengan a los usuarios comprometidos.
8. Tasa de Abandono
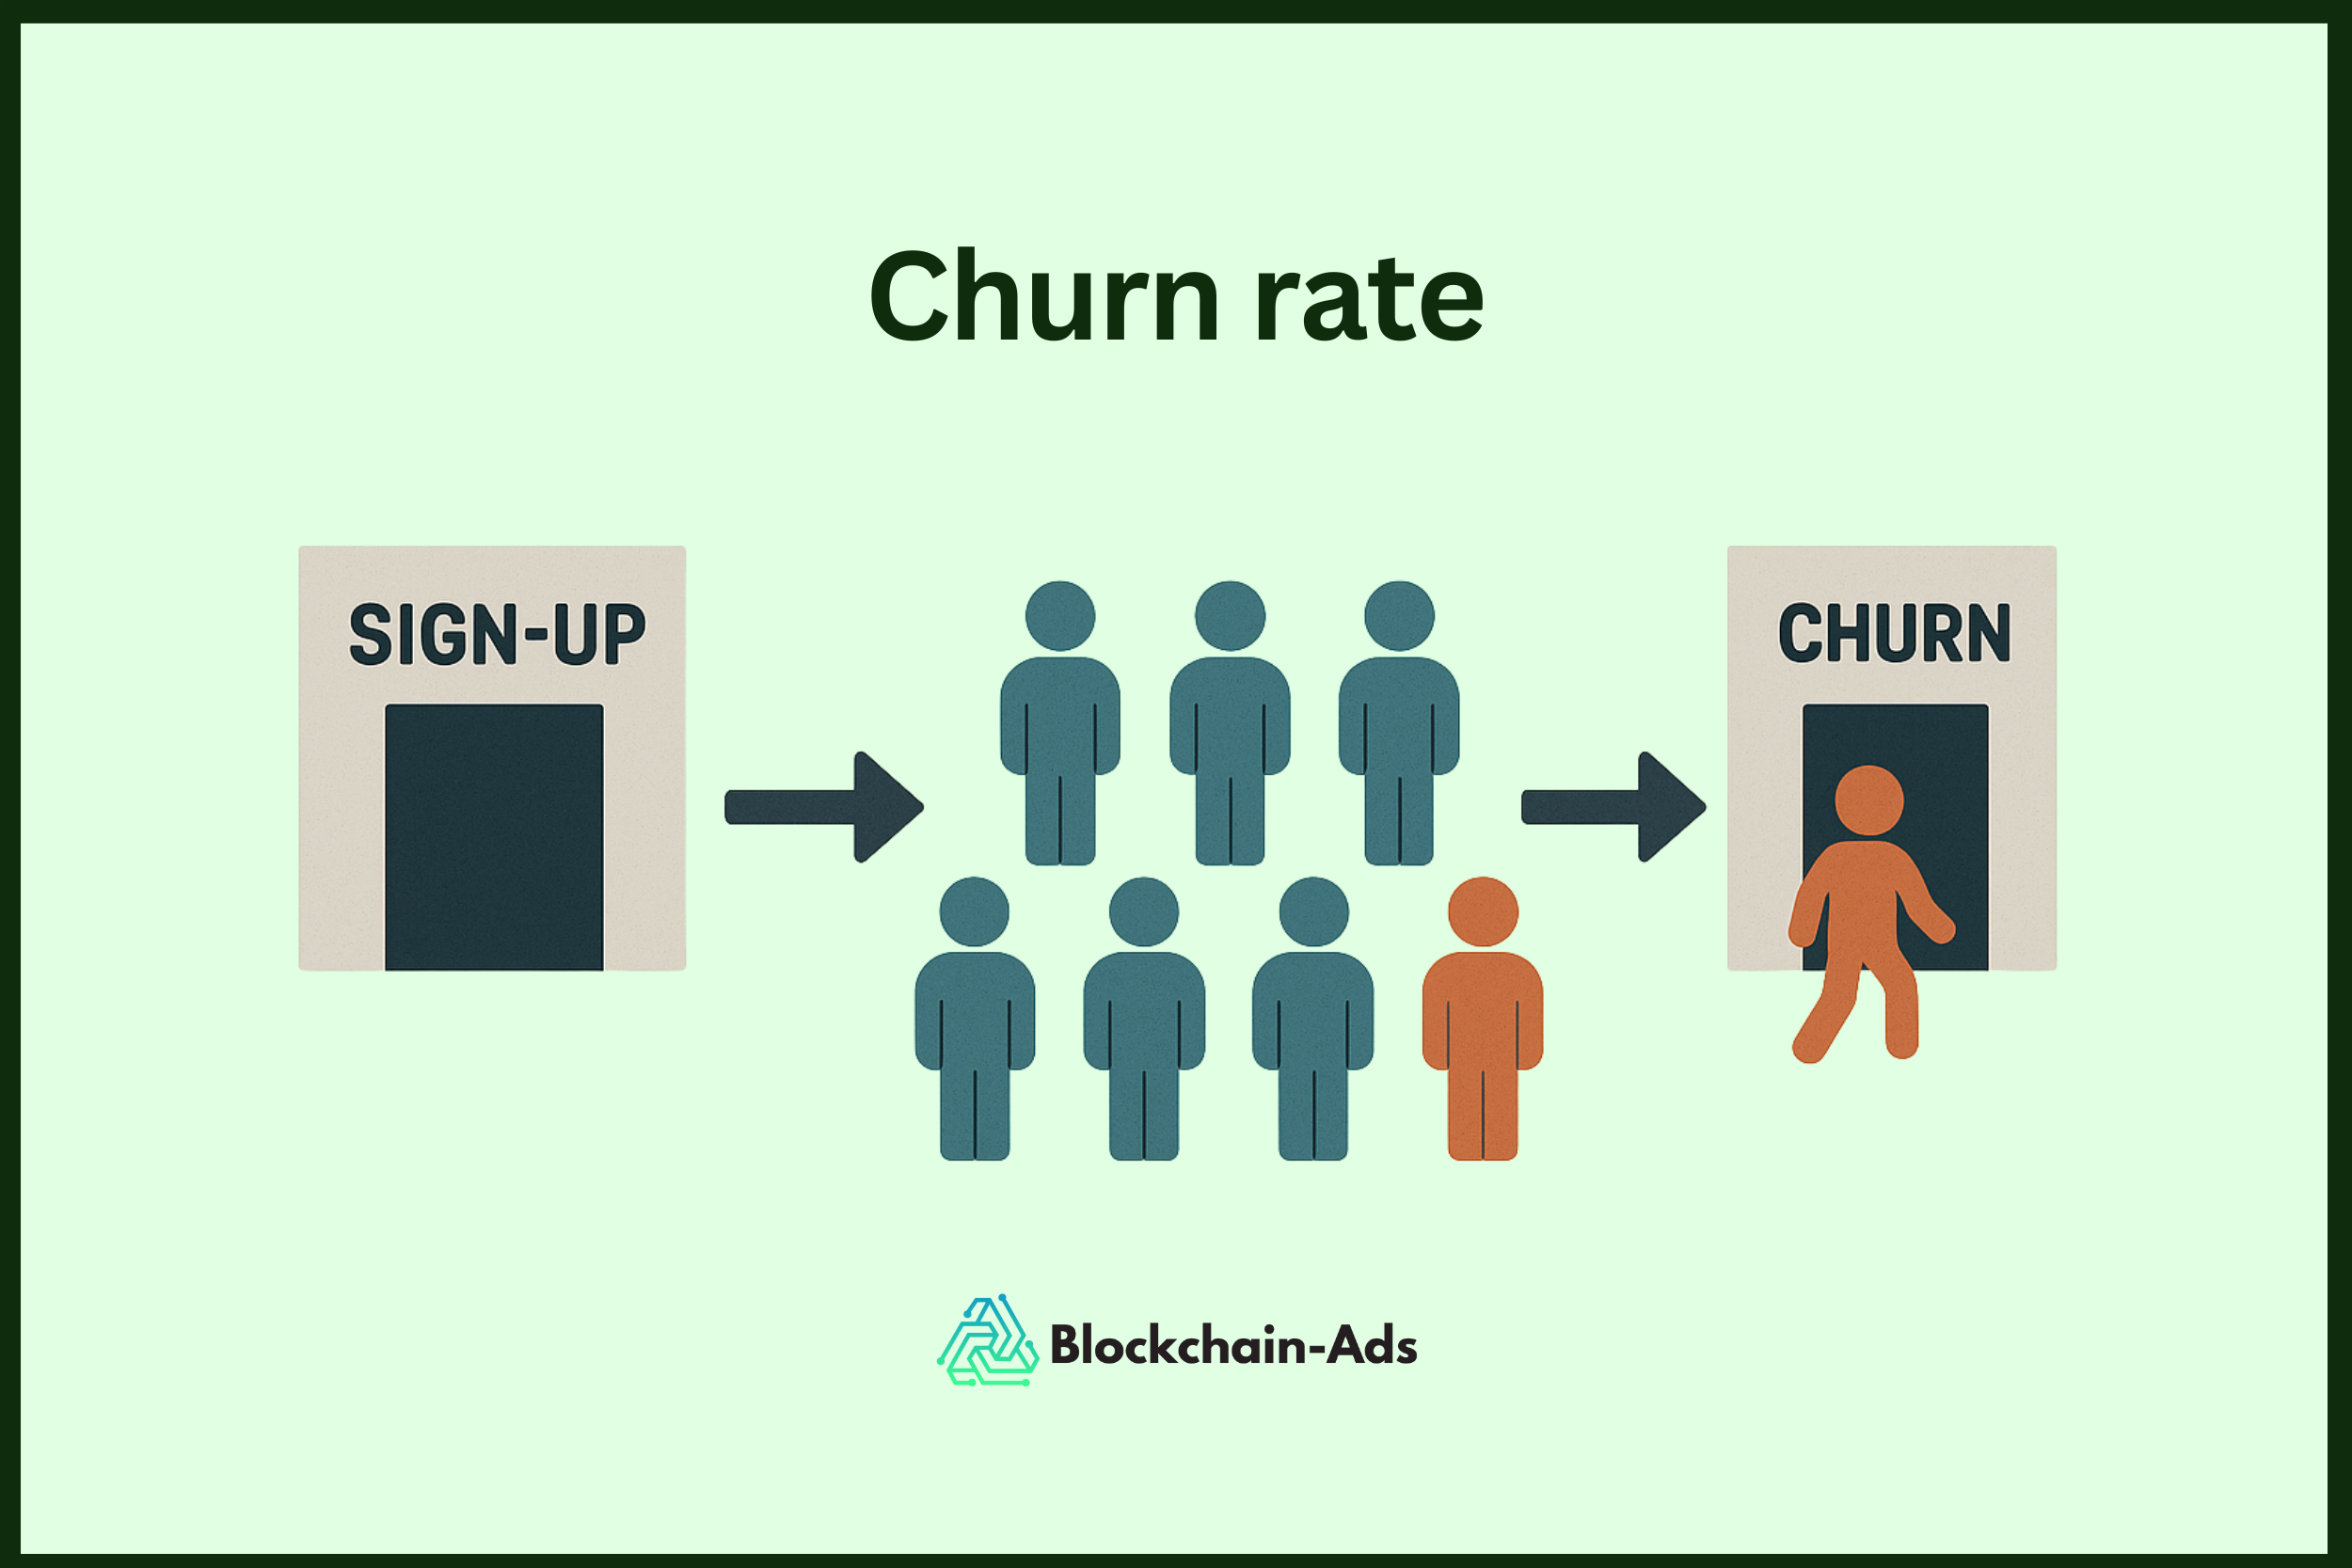
Comenzamos esta lista con la tasa de retención; ahora discutiremos su opuesto, que es la tasa de abandono. La tasa de abandono mide el porcentaje de usuarios que dejan de usar tu app durante un período de tiempo específico. Un alto abandono significa que tu app puede no cumplir con las expectativas de los usuarios, o que los competidores ofrecen algo mejor.
Para calcular el abandono, resta tu tasa de retención de 100%. Por ejemplo, si tu tasa de retención de 30 días es del 25%, entonces tu tasa de abandono para el mismo período es del 75%. Necesitas monitorear el abandono porque te ayuda a identificar rápidamente problemas con la experiencia del usuario, la incorporación o el valor de las funciones.
Caídas de la App
Ocurren caídas inesperadas de la app, por lo que necesitas rastrearlas. Las caídas de la app muestran con qué frecuencia tu aplicación se cierra inesperadamente mientras los usuarios interactúan con ella. Esta métrica es crítica porque las caídas frecuentes pueden alejar rápidamente a los usuarios y dañar la reputación de tu app.
Puedes rastrear las caídas usando herramientas de analítica que reportan eventos de caída por sesión o por usuario. Las altas tasas de caídas señalan bugs, problemas de compatibilidad de dispositivos o problemas con nuevas actualizaciones. Los equipos usan estos datos para corregir problemas urgentes y mantener la app funcionando sin problemas. Una app estable y sin caídas ayuda a retener usuarios y construir confianza a lo largo del tiempo.
Acciones Dentro de la App
Hasta ahora, nos hemos enfocado en si los usuarios se quedan o se van. Las acciones dentro de la app miden qué hacen los usuarios cuando se quedan, como con qué frecuencia completan tareas específicas o usan ciertas funciones dentro de tu app. Estas pueden incluir cosas como hacer una compra, enviar un mensaje, ver un video o desbloquear un nivel. Rastrear las acciones dentro de la app te brinda una imagen clara de cómo los usuarios interactúan con tus ofertas principales.
Los equipos a menudo configuran eventos personalizados en herramientas de analítica para registrar estas acciones. Cuando observas qué acciones son más populares, puedes identificar qué funciones generan valor y qué necesita mejorarse.
Valor de Vida del Cliente (LTV)

Finalmente, nos enfocamos en el dinero, que realmente es la razón por la que se crean las apps en primer lugar. El valor de vida del cliente (LTV) estima los ingresos totales que obtienes de un usuario durante su tiempo con tu app. Esta métrica te ayuda a entender cuánto vale cada usuario, lo que moldea tus decisiones de marketing e inversión en productos.
Para encontrar el LTV, multiplica el valor promedio de una compra por el número de compras por usuario, luego por el tiempo promedio de retención. Un LTV alto significa que los usuarios permanecen comprometidos y gastan más con el tiempo, mientras que un LTV bajo señala oportunidades perdidas. Rastrear el valor de vida asegura que tu equipo se enfoque en el crecimiento a largo plazo, no solo en descargas a corto plazo.
Cómo Analizar las Métricas de Engagement de Apps
Rastrear las métricas correctas es solo el comienzo. El valor real proviene de darle sentido a los números y detectar tendencias que impulsan decisiones inteligentes. Aquí te mostramos cómo profundizar en tus datos y obtener la información que necesitas para mejorar tu app.
Configurar Analítica
Puedes configurar herramientas de analítica como Appsflyer o Blockchain Analytics para rastrear cada evento importante dentro de tu app. Estas plataformas te permiten capturar detalles sobre instalaciones, acciones de usuarios, retención, caídas e ingresos en tiempo real. Configurar analítica significa agregar un kit de desarrollo de software (SDK) a tu app y configurar los eventos clave que deseas medir.
Una vez conectadas, estas herramientas recopilan datos cada vez que un usuario abre la app, explora funciones o completa una transacción. También puedes segmentar usuarios por dispositivo, región o comportamiento para revelar patrones más profundos. Con datos claros a tu alcance, tu equipo puede moverse rápidamente, corregir puntos débiles y duplicar las funciones que los usuarios aman.
Crear Combinaciones de Métricas Significativas
Observar las métricas de forma aislada solo cuenta parte de la historia. Combina métricas clave como retención, duración de sesión y acciones dentro de la app para ver cómo se conectan. Por ejemplo, cruzar la tasa de retención con el uso de funciones puede revelar qué funciones hacen que las personas regresen.
También puedes emparejar el ratio DAU/MAU con la tasa de abandono para detectar si los usuarios frecuentes están comenzando a abandonar. Estas combinaciones ayudan a los equipos a comprender causa y efecto, no solo tendencias superficiales. Con los pares de métricas correctos, puedes descubrir información que guíe decisiones inteligentes de producto y marketing dirigido.
Interpretar Patrones y Tendencias de Datos
Los números en bruto importan menos que la historia que cuentan. Siempre busca patrones como picos, caídas y ascensos constantes en lugar de solo resultados de un solo día. Las tendencias a lo largo del tiempo revelan cómo los usuarios responden a actualizaciones, nuevas funciones o campañas de marketing.
Desglosa los datos por segmento de usuario, como nuevos usuarios versus fans leales, para ver quién prospera y quién tiene dificultades. Detectar señales de advertencia tempranas, como una caída en la retención o un aumento en las caídas, te permite corregir problemas antes de que crezcan.
Beneficios de la Analítica de Engagement de Apps Móviles
La analítica de engagement de apps viene con múltiples beneficios, incluyendo ayudarte a ver qué mantiene felices a los usuarios y qué los hace abandonar. Veamos algunos de estos:
Tasa de Retención y Usuarios Activos
Rastrear la retención y los usuarios activos muestra cuántas personas siguen regresando y con qué frecuencia abren tu app. Si estos números se mantienen fuertes, tu app probablemente satisface las necesidades reales de los usuarios. La retención débil o los recuentos bajos de usuarios activos generalmente apuntan a problemas con la incorporación, funciones faltantes o una mala experiencia del usuario.
Satisfacción o Insatisfacción del Usuario
También recibes datos sobre qué complace a los usuarios de tu app. La analítica de engagement te ayuda a aprender qué les gusta a los usuarios y qué los frustra. Si las personas interactúan a menudo con ciertas funciones, esas probablemente aportan valor. Las funciones con poca actividad o altas tasas de abandono a menudo señalan confusión o decepción.
Usa esta información para mejorar tu app, eliminar fricciones y construir una mejor experiencia de usuario que haga que las personas sigan regresando.
Tasa de Conversión
Finalmente, la tasa de conversión mide cuántos usuarios completan una acción clave, como registrarse, realizar una compra o actualizar. Las altas tasas de conversión muestran que el flujo y las funciones de tu app animan a los usuarios a dar el siguiente paso. Las tasas bajas a menudo apuntan a pasos confusos, falta de valor o fricción en el proceso.
Los equipos usan estos datos para refinar la incorporación, ajustar ofertas o probar nuevos diseños que faciliten que los usuarios conviertan.
Usar Datos de Métricas para Aumentar el Engagement de Usuarios de Apps
Las métricas de esta guía te brindan una hoja de ruta clara para impulsar el engagement. Cuando ves dónde los usuarios se atascan o abandonan, puedes probar nuevos flujos de incorporación, actualizar funciones o mejorar el contenido para mantener a las personas interesadas.
Los puntajes altos de engagement también destacan lo que funciona, para que puedas duplicar tus fortalezas y construir nuevas funciones alrededor de hábitos comprobados. Los equipos inteligentes usan estos datos para dar forma a estrategias de notificaciones push, lanzar ofertas por tiempo limitado o crear recompensas para usuarios leales.
En general, cada información que obtienes de tus métricas te ayuda a ofrecer una experiencia más fluida y valiosa que hace que los usuarios sigan regresando.